 Embedded HandbookApps
36г. Oscilloscope, part 1: channel input, time base, memory and acquisition modes
Section 36а covers the oscilloscope as an instrument: probe, bandwidth, triggering, ground. This section goes through its menus, item by item. Every knob and every switch has a reason to exist: there is something the instrument cannot decide on its own and leaves to a person. If you do not know what that is, the knob stays at its default — and the instrument honestly shows what it was told to show, not what is on the wire.
This part is about how a signal gets into memory: the channel input (vertical), the time base (horizontal) and acquisition (how ADC samples become points on the screen). For each item: what it is, what it is for, what you see with it and without it, and a typical mistake. Triggering is part 2 (36д); cursors, automatic measurements, math and FFT are part 3 (36е); bus decoding, masks, segmented memory and SCPI control are part 4 (36ж).
The examples use the author's instrument, a RIGOL DHO900: menu items are named in English as they appear on the screen, and the figures come from its documents. The effects themselves are common to any digital oscilloscope; whatever applies only to the DHO900 is marked as such.
Sources: RIGOL DHO900 Datasheet (Books/dho900-datasheet.pdf; pages here
and below are PDF file pages): p. 4 — overview, p. 9 — specification
summary, p. 10 — vertical system, pp. 11–12 — horizontal system and
acquisition, p. 22 — display, p. 26 — notes; DHO900 User Guide
(Books/DHO900_UserGuide_EN.pdf): pp. 55–62 — Vertical menu, pp. 64–67 —
Horizontal and Zoom, pp. 68–76 — acquisition, memory, Roll and XY, pp. 247–249 —
display; STM32F103 datasheet (CD00161566, table 7 — pin current). All
calculated figures come from a run of _verify/scope36g/model36g.py (Python 3.11
and numpy in the stm-lab:1 container).
What it is called in the documentation
Original Meaning vertical scale, V/div; Fine volts per division; fine adjustment between the 1-2-5 steps vertical resolution, 12 bits ADC resolution: the number of vertical levels offset, position offset: a shift of the signal in volts before the ADC coupling DC / AC / GND input coupling: direct, through a capacitor, input grounded input impedance input resistance of the channel BW Limit bandwidth limit filter probe ratio; Unit probe attenuation; unit (V, A, W) Invert channel inversion time base, s/div; Vernier seconds per division; fine adjustment horizontal position, delay position of the trigger point, delay Roll, slow sweep (SCAN) chart recorder mode; slow sweep Zoom, delayed sweep magnifier, a second time base window XY mode, Lissajous figure XY mode, Lissajous figure memory depth (Mem Depth), sample rate (SaRate) record length, sample rate aliasing a false, slower picture of the signal acquisition mode: Normal, Peak, Average, High Res acquisition mode: normal, peak detect, averaging, high resolution waveform capture rate, dead time waveforms per second, time the instrument is blind persistence, intensity grading, Color Grade persistence, brightness by hit count, color scale
36г.1 Screen, graticule and where the settings live
The oscilloscope screen is a grid of 10 horizontal divisions and 8 vertical ones (the DHO900 datasheet says exactly that, p. 22). All the knobs set one thing: how many volts and how many seconds fall into one division. Vertical settings are per channel; horizontal settings are shared by all channels.
The ADC range is the screen. On the DHO900 the dynamic range of a channel is ±4 divisions (datasheet p. 10): exactly from the bottom edge of the grid to the top. What goes past the edge is not "hidden" — it is not in memory at all (36г.9). Hence the main skill of this part: stretch the signal over the screen, but no further.
Channels share the instrument. The DHO900 gives 1.25 GSa/s and 50 M points only when one channel is on; with two — 625 MSa/s and 25 M, with three or four — 312.5 MSa/s and 10 M (datasheet p. 9). Switching off a channel you do not need is a free gain in sample rate and memory.
On the DHO900 the vertical menu opens when you tap the channel label at the bottom of the screen (Vertical); the horizontal and acquisition menu opens from the labels at the top (Horizontal, with Acquisition in the same place; User Guide pp. 64, 68).
36г.2 Volts per division: coarse and fine
What it is. The vertical scale — how many volts per division. The SCALE knob moves in 1-2-5 steps; on the DHO900 from 200 µV/div to 10 V/div with a 1X probe (User Guide pp. 55–56). The Fine switch (or pressing the knob) turns on fine adjustment between the steps.
What it is for. To make the signal fill the screen. A signal with a 3.3 V swing:
| scale | divisions occupied | ADC levels across the swing: 8 bits | 12 bits |
|---|---|---|---|
| 5 V/div | 0.66 | 21 | 338 |
| 1 V/div | 3.30 | 106 | 1690 |
| 0.5 V/div | 6.60 | 211 | 3379 |
With it and without it. At 5 V/div a 3.3 V square wave is a strip two thirds of a division tall: the edge is visible, but neither an overshoot nor a dip on the flat top can be seen. At 0.5 V/div the same signal fills almost the whole screen, and each ADC level is ten times finer.
Fine. Fine adjustment is needed when the signal is slightly larger than the screen at one step and noticeably smaller at the next. Mistake: Fine left on — the scale leaves the 1-2-5 series, and counting "by the squares" gives wrong values. Read values with cursors and automatic measurements (36е).
The smallest steps are not real. On the DHO900, 200 and 500 µV/div are the 1 mV/div setting stretched digitally (datasheet p. 26, note 4). The 12-bit ADC step at 1 mV/div is 1.95 µV; at 200 µV/div the whole screen spans 819 such steps, and no new detail appears — the picture is just larger.
36г.3 ADC resolution: 8 and 12 bits, and why you fill the screen
What it is. The ADC divides its range (the whole screen) into 2^N levels: 256 at 8 bits, 4096 at 12. Most low-cost oscilloscopes are 8-bit; the DHO900 has 12 bits (datasheet pp. 4, 9, 10).
What it is for. Small details on a large signal: ripple on a supply, a DAC step, the flat top of a pulse. Model: a sine digitized by an ideal ADC, with the rounding error as the only noise.
| sine occupies | 8 bits: signal/noise | effective bits | 12 bits: signal/noise | effective bits |
|---|---|---|---|---|
| the whole screen | 49.7 dB | 8.0 | 73.8 dB | 12.0 |
| one division of 8 | 31.3 dB | 4.9 | 55.8 dB | 9.0 |
With this and without it. A signal that occupies one division of eight loses three bits: an 8-bit instrument becomes a 5-bit one, a 12-bit one becomes 9-bit. 12 bits give headroom — but they do not cancel the rule: stretch the signal over the screen. At 5 V/div a 12-bit instrument has 338 levels across 3.3 V (table in 36г.2) — more than an 8-bit one at 0.5 V/div (211), but 10 times fewer than the same instrument gives at 0.5 V/div (3379).
Mistake. Taking the ADC resolution for the measurement resolution. In the model the only noise is rounding; a real instrument has the noise of its own input amplifier, and it eats some of the bits. The DHO900 promises a low noise floor (datasheet p. 4), but the documents give no noise figure.
36г.4 Offset and position
What it is. Offset is a voltage the instrument subtracts from the signal before the ADC; position is a shift of the picture on the screen. On the DHO900 this is a single POSITION knob: it changes Offset in volts, and pressing it resets the offset to zero (User Guide p. 56). The offset limit depends on the scale (datasheet p. 10):
| scale | offset limit |
|---|---|
| below 500 µV/div | ±0.5 V |
| from 500 µV/div to 65 mV/div | ±1 V |
| above 65 mV/div up to 270 mV/div | ±8 V |
| above 270 mV/div up to 2.75 V/div | ±20 V |
| above 2.75 V/div up to 10 V/div | ±100 V |
What it is for. To look at something small riding on something large: 50 mV of ripple on a 12 V rail. Without offset the 12 V has to fit on the screen, and the ripple is lost. With an offset of −12 V the screen centre sits at 12 V, and the scale can be reduced as far as the offset limit allows. On the DHO900 the finest 1-2-5 step where the offset still reaches 12 V is 500 mV/div (limit ±20 V). There the 12-bit ADC step is 0.977 mV, and the 50 mV ripple spans 51 levels (an 8-bit instrument would give 3.2 levels — steps instead of a shape).
Without offset and with it — where it runs out. At 10 mV/div the DHO900 offset is limited to ±1 V: the 12 V cannot be brought back onto the screen, and the trace sits at the edge. Here you need AC coupling (36г.5): the DC part goes away, and at 10 mV/div the ripple spans 2560 levels.
Mistake. The offset was left over from a previous measurement: the signal "disappeared", but it is past the edge of the screen — and did not get into memory (36г.9). The first move on an empty screen is to press the POSITION knob. Next to it in the DHO900 menu there is Bias — zero correction of the channel for drift (User Guide p. 61); it is not an offset for viewing, and there is no reason to touch it without need.
36г.5 Input coupling: DC, AC, GND
What it is. The Coupling setting (User Guide p. 57; the DHO900 has DC, AC and GND, datasheet p. 10). DC passes the whole signal. AC goes through a series capacitor: the DC part is cut off and the AC part remains. GND disconnects the input from the signal and shows the zero line.
What it is for. AC — for a small AC part on a large DC level (36г.4) and for viewing ripple. GND — to find where zero is on the screen before you measure levels.
What you see with AC and without it. The capacitor and the input resistance form a high-pass filter. The documents do not give the cutoff frequency of the DHO900 AC input; the model uses a nominal 10 Hz (time constant 15.9 ms):
- a 50 Hz square wave 0…3.3 V: the flat top droops by 30.4 % over a half period;
- a 1 kHz square wave: droop of 1.6 % — barely visible;
- 1 kHz PWM with a 10 % duty cycle: the average is removed, and the levels on the screen are 2.97 V and −0.33 V instead of 3.3 V and 0;
- a 1 Hz sine: 10.0 % of the amplitude remains.
Mistake. Measuring logic levels with AC coupling: the PWM "zero" comes out negative, the "one" below the supply, and any conclusion drawn from them is false. Slow signals — DC only (the DHO900 User Guide recommends the same for slow sweep, p. 74).
36г.6 Input impedance: 1 MΩ and 50 Ω
What it is. A high-impedance 1 MΩ input barely loads the circuit; a 50 Ω input is a matched termination for a 50 Ω cable. The DHO900 has no 50 Ω input: only 1 MΩ ±1 % in parallel with 15 pF ±3 pF (datasheet p. 10, User Guide p. 58).
Why 50 Ω. A generator, an RF path, a long coaxial cable: without a 50 Ω load at the end the signal reflects and rings (section 160). On an instrument without such an input you put an external 50 Ω feed-through terminator on the connector.
What you see. A generator with a 50 Ω output and an EMF of 1 V gives 0.5 V on a 50 Ω load and 1.0000 V on a 1 MΩ input. Hence the common complaint "the generator shows twice what was set" — the generator assumed it was loaded with 50 Ω.
Mistake — a microcontroller pin into a 50 Ω input. 3.3 V on 50 Ω is 66 mA and 218 mW: 2.6 times the 25 mA limit per F103 pin (table 7 of the datasheet). The pin is overloaded, and the levels on the screen are not those in the circuit. Digital lines — only through the 1 MΩ input and a 1:10 probe (36а.2).
36г.7 Bandwidth limit (BW Limit)
What it is. A low-pass filter in the channel. On the DHO900 — 20 MHz or FULL (no limit), selectable per channel (datasheet p. 10; BW Limit menu — User Guide p. 57); the full bandwidth is 125 or 250 MHz depending on the model (datasheet p. 9).
What it is for. Noise. White noise grows as the square root of the bandwidth: in the model (a single-pole filter), going from 250 MHz to 20 MHz reduces it by a factor of 0.287 (the square root of the bandwidth ratio gives 0.283). A nominal 3 mV of noise becomes 0.86 mV — just what you need for supply ripple and slow analog signals.
The price. The limit cuts the signal too. The 105 MHz ringing from the probe ground lead (36а.2) keeps 19 % of its amplitude behind a 20 MHz filter — and "disappears". A 5 ns edge looks like 18.2 ns: the limit's own rise time is 17.5 ns (root-sum-of-squares addition, 36а.3).
Mistake. BW Limit left on while you look for ringing and overshoot: the picture is clean, and the problem "does not reproduce". And the other way round — millivolt ripple at full bandwidth drowns in the instrument's own noise.
36г.8 The probe in the menu: ratio, units, inversion
Probe ratio (Probe). The instrument does not know which probe is plugged in — it has to be told. The DHO900 offers 0.001X to 50000X, 1X by default (User Guide pp. 59–61); some probes are recognized automatically. Mistake: the probe is switched to 1:10 but the menu says 1X — the screen shows 0.33 V instead of 3.3 V; the other way round — 33 V. A one-second check: the calibrator output on the front panel.
Units (Unit). On the DHO900 — V, A, W or U (User Guide p. 61). Current through a shunt: 0.1 Ω and 250 mA give 25 mV. Set the ratio to 10X and the unit to A, and the instrument shows 250 mA — and the automatic measurements are in amperes right away. Mistake: the shunt was changed and the ratio was not.
Inversion (Invert). Flips the channel signal (User Guide pp. 58–59). Why: current through a shunt in the supply return shows up as negative; flipped, it is easier to compare with the current in the positive rail. On the DHO900 the math, the measurements and even the trigger edge flip together with the picture. Mistake: inversion left on — a "rising edge" trigger fires on the falling edge, and the polarity of every conclusion is reversed.
36г.9 Input overload
What it is. A signal larger than the ADC range — larger than the screen (on the DHO900 ±4 divisions, 36г.1). Everything above the edge is recorded as the edge.
What you see. A 0…3.3 V square wave at 100 mV/div without offset: the top of the screen is 0.4 V, and the signal is 8.25 times larger. Memory holds a flat top at 0.400 V, and the "peak-to-peak" measurement honestly reports 0.4 V. Worse is what you do not see: after an overload the input amplifier does not recover at once, and the stretch right after the overload is distorted. For how long — the DHO900 documents do not say; the general rule: for accurate measurements the whole signal stays on the screen.
The input limit is not permission to go onto the mains. The DHO900 input is rated CAT I, 300 V rms and 400 V peak (datasheet p. 10). CAT I means circuits not directly connected to the mains; the input is not rated for the mains (CAT II and above). How to look at mains circuits — 36з and 208.7.
Mistake. The screen was stretched to see a detail of the flat top — and then peak-to-peak or overshoot is measured on a clipped picture. First the whole signal on the screen, then the detail — with offset (36г.4) or with the zoom (36г.12).
36г.10 Time per division, position and delay
What it is. Time per division (Scale in the Horizontal menu) — how many seconds one horizontal square holds; the screen window is 10 divisions. On the DHO900 — from 2 ns/div to 500 s/div (datasheet p. 11), in 1-2-5 steps or smoothly (Vernier, User Guide p. 65). Position — where the trigger point sits relative to the screen centre (pp. 65–66). The Expand item selects the reference the picture is compressed around when the scale changes: the centre (default), an edge, the trigger point or a user point (pp. 73–74).
Why position. Move the trigger point to the left — you see what came after the event; to the right — what came before it. On the DHO900 you can allow 5 divisions before the trigger and up to 1 s or 100 divisions after it, whichever is greater (datasheet p. 11).
Delay instead of a slow time base. An event happens 5 ms after the trigger, and you want to examine it at 1 µs/div. If you turn the knob to 1 ms/div for that, a 10 k-point memory is spread over 10 ms — 1 MSa/s, a sample every 1 µs: the detail is not visible. If you stay at 1 µs/div and set the position to 5 ms (within the 1 s limit), the window shows the right place at 1000 MSa/s.
Mistake. Hunting for a rare event by "winding" the time base slower, and then wondering why its edge has two points on it. A slow time base is for finding; delay and zoom (36г.12) are for examining.
36г.11 Chart recorder (Roll) and slow sweep
What it is. On slow time bases, waiting for the screen to fill takes a long time — so the instrument switches to chart recorder mode: points appear on the right and push the picture to the left continuously, without a trigger. On the DHO900 the Roll item: Auto enables the recorder from 50 ms/div and slower; OFF gives a slow sweep instead from 200 ms/div, which draws left to right and waits for a trigger (User Guide p. 74; datasheet p. 12 — ROLL and SCAN).
What it is for. Slow things: battery discharge, warm-up, the order in which supplies come up, a sensor's slow drift. At 1 s/div the window is 10 s; at 50 ms/div — 0.5 s.
What is lost. In Roll the DHO900 has no trigger, persistence, averaging, UltraAcquire, XY, decoding, zoom or digital channels (User Guide p. 74).
Mistake. Expecting the recorder to stop on an event — there is no trigger, and the picture scrolls away. For a single slow event — Roll OFF and a trigger (36д). And DC coupling: with AC a slow signal decays to zero (36г.5).
36г.12 Zoom
What it is. A second time base window: the screen splits in two, the whole record on top and a stretched section below (on the DHO900 — the Zoom switch in the Horizontal menu, User Guide pp. 66–67; the zoom scale is no coarser than the main one).
What it is for. To see both the whole and the detail at once: a burst of bytes and the edge of one bit, a whole motor start and the first current pulse.
What you see. Zoom shows only what is already in memory. Main time base 1 ms/div, zoom over 10 µs: with a 10 k-point memory (1 MSa/s) the zoom window holds 10 points, and the instrument draws straight lines between them; with 50 M points (1.25 GSa/s) — 12500 points, and the edge is real.
Mistake. Zooming into a record taken with shallow memory and taking the connecting lines for the shape of the signal. Memory depth first (36г.14), then zoom.
36г.13 XY mode
What it is. The horizontal axis is not time but the voltage of a second channel: each point is drawn at coordinates (X, Y). On the DHO900 the sources are chosen in Source X and Source Y (User Guide p. 75).
What it is for. To compare two signals of the same frequency: the phase shift between the input and output of a filter; the current-voltage curve of a part (X — voltage, Y — current through a resistor). The phase shift comes from the ellipse: the sine of the angle equals the height where the ellipse crosses the axis divided by its full height (User Guide p. 76). Model: two 1 kHz sines shifted by 30° — ratio 0.500, angle 30.0°; at 90° the ratio is 1.000 and the ellipse becomes a circle.
With it and without it. In the time domain a 30° shift is two sine waves you have to measure with cursors. In XY the ellipse shape is there at once, and any distortion (clipping, non-linearity) shows up as a kink in the figure.
Mistake. Viewing signals of different frequencies in XY — the figure rotates and has no phase. And remember that XY takes two channels: on the DHO900 the sample rate is shared (36г.1).
36г.14 Memory depth and sample rate
What it is. Memory depth (Mem Depth) — how many points the instrument records per acquisition. The screen window is 10 divisions; all points must fit into it, so the sample rate is the memory divided by the window, but no more than the ADC limit (the DHO900 User Guide states this as a formula, p. 73). On the DHO900 the depth is chosen from Auto and from 1 k to 50 M points; the default is 10 k (User Guide p. 73).
Model for the DHO900 (window of 10 divisions):
| time base | memory 10 k (default) | 50 M, one channel | 10 M, four channels |
|---|---|---|---|
| 1 µs/div | 1000 MSa/s | 1.25 GSa/s | 312.5 MSa/s |
| 100 µs/div | 10 MSa/s | 1.25 GSa/s | 312.5 MSa/s |
| 1 ms/div | 1 MSa/s | 1.25 GSa/s | 312.5 MSa/s |
| 10 ms/div | 100 kSa/s | 500 MSa/s | 100 MSa/s |
With 10 k points the full rate holds only up to 800 ns/div; with 50 M — up to 4 ms/div. The interval between samples is 0.8 ns with one channel and 3.2 ns with four.
Why deep memory. To see something fast on a slow time base: a whole SPI burst and every edge in it. Shallow memory at the same time base — the sample rate drops thousands of times, and a short pulse slips between the points: a 20 ns pulse with a sample every 200 ns gets into the record in 10 % of cases (36г.16).
The price. A long record takes longer to process: the screen updates less often (36г.17), and measurements are computed more slowly. In Average mode the DHO900 limits the depth to 10 M points (User Guide p. 73).
Mistake. Never touching memory depth at all. The default 10 k is for a fast screen, not for debugging a bus; Auto picks the depth itself, and which one it picked is shown in the acquisition label at the top of the screen.
36г.15 Aliasing
What it is. With fewer than two samples per period the instrument reconstructs the wrong signal — a slower one — and draws it confidently and steadily (User Guide p. 71).
What it looks like. 100 kHz PWM from a timer; the crystals of the instrument and the board differ by 50 ppm (the DHO900 time base accuracy is ±25 ppm, datasheet p. 11, and the board's crystal has its own tens of ppm), so the real frequency is 5 Hz higher. Time base 20 ms/div, memory 10 k: 50 kSa/s, Nyquist limit 25 kHz. The screen shows a clean 5.000 Hz square wave, exactly 1 period per window. This is not the signal but the difference between the PWM frequency and a multiple of the sample rate. With 50 M of memory at the same time base — 250 MSa/s, 2500 samples per period, and the real PWM is visible.
How to tell. Change the time base by one step: a real signal compresses by a factor of two, a false one changes arbitrarily. Turn on Peak (36г.16): the peak detector shows a solid band — the PWM envelope — instead of the false wave (User Guide p. 69). Increase the memory depth.
Mistake. Trusting the instrument's frequency counter on such a picture: it will honestly measure 5 Hz.
36г.16 Acquisition modes: Normal, Peak, Average, High Res
What it is. The ADC always runs at the full rate; the acquisition mode decides what from the stream of samples goes into a memory point when there is less memory than samples. The DHO900 has four modes: Normal (default), Average, Peak and UltraAcquire (User Guide p. 68); High Res, which other instruments have, is not available on the DHO900.
Model: window 2 ms (200 µs/div), memory 10 k — 5 MSa/s, a memory point every 200 ns; 12-bit ADC at 1.25 GSa/s — 250 samples per point. Signal: a 1 kHz square wave, 50 mV of noise, and once per record a 2 V glitch 20 ns long at a random place.
| mode | what goes into a point | noise on screen | glitch 2 V × 20 ns |
|---|---|---|---|
| Normal | one sample of 250 | 50 mV | caught in 9.8 % of records (calculated 10 %) |
| Peak | minimum and maximum of 250 | band of 0.28 V | 2.07 V — in every record |
| High Res | mean of 250 | 3.1 mV (calculated 3.2; +4.0 bits) | squeezed to 0.20 V |
| Average, 16 | mean of 16 records | 12.3 mV (calculated 12.5; +2 bits) | got into 1 record of 16 — 0.11 V (calculated 0.125) |
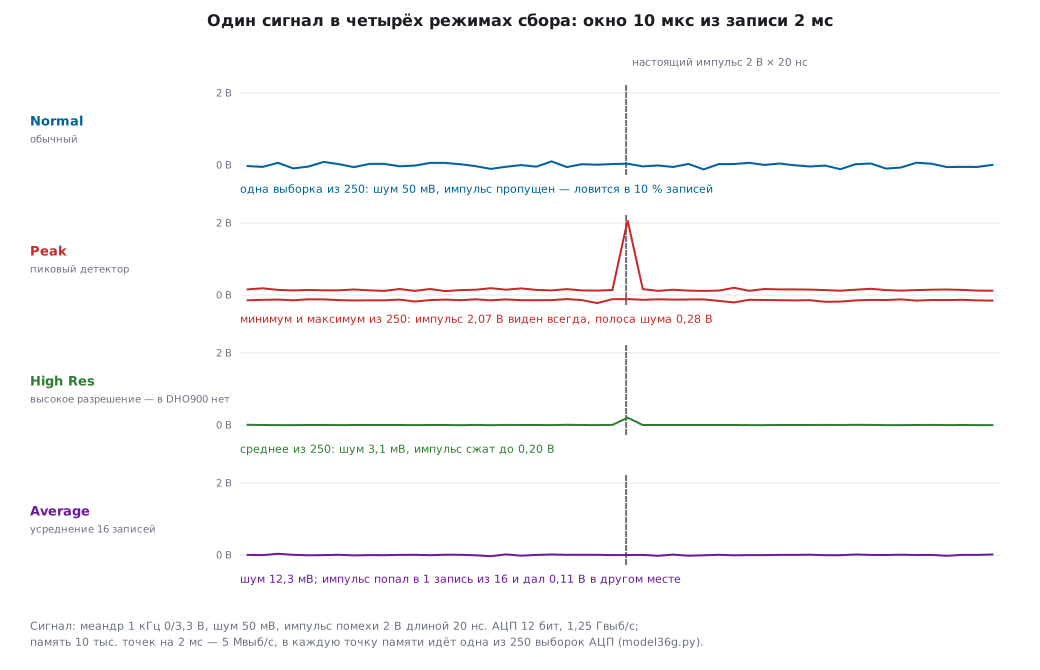
Normal — samples at equal intervals. The honest shape of everything slower than the sample rate. Without the other modes you do not see short events: a pulse narrower than the point interval is caught only now and then.
Peak — the minimum and maximum of each interval go into memory. Why: not to miss a narrow pulse on a slow time base and not to fall into aliasing (36г.15). The DHO900 peak detector catches glitches down to 1.6 ns (datasheet pp. 9, 12). The price — the noise looks wider than it is: a band of 0.28 V for 50 mV of noise. Mistake: measuring noise or peak-to-peak in Peak.
Average — the mean of several records, point by point. Noise drops as the square root of the number of records, and resolution grows (on the DHO900 from 2 to 65536 records, powers of two only; not compatible with the digital channels — User Guide pp. 68–69). It works only for a signal that repeats exactly from the trigger point. Mistake: averaging something asynchronous: a random glitch is divided by 16 and vanishes, a jittering edge smears into a slow one.
High Res (on other instruments) — the mean of neighbouring samples within one record: the noise drops without repeats, and it works for a single event too. The price is bandwidth: everything shorter than the point interval is smoothed out (the 2 V glitch became 0.20 V).
UltraAcquire on the DHO900 is not about what goes into a point but about how often the instrument looks: 36г.17.
36г.17 Update rate and dead time; UltraAcquire
What it is. After each record the instrument processes and draws it — and during that time it does not look at the input. This is dead time. The update rate is how many waveforms per second the instrument manages to capture. The DHO900 does up to 30 000 waveforms/s normally and up to 1 000 000 in UltraAcquire (datasheet p. 9).
What it means. At 10 ns/div a record lasts 100 ns. 30 000 such records per second — the instrument looks 0.3 % of the time and is blind 99.7 %. A glitch that happens 10 times a second appears on the screen on average after 33.33 s (the model's random trial gives 33.2 s), and with 95 % probability within 99.9 s. At 1 000 000 waveforms/s the instrument looks 10 % of the time: on average 1 s (random trial — 0.992 s), 95 % within 3 s.
UltraAcquire. Memory is divided into segments, each trigger fills its own segment, and the instrument draws them in a batch — so the dead time between triggers becomes minimal (User Guide p. 69). The segments are shown side by side, overlaid, as a "waterfall", in perspective or as a mosaic. In UltraAcquire the DHO900 disables cursors, decoding, zoom, search, masks and waveform recording (User Guide p. 70). Segmented memory as a tool — part 4 (36ж).
Mistake. Thinking that a glitch does not exist because it did not show up in a minute of watching. For rare events — a conditional trigger (36д), not waiting at the screen. The highest update rate is not reached at every setting; at which ones on the DHO900 — the documents do not say.
36г.18 Persistence and intensity
What it is. Persistence (Persistence Time) — how long old waveforms stay on the screen over the new ones. On the DHO900 — Min, from 100 ms to 10 s, or Infinite (User Guide pp. 247–248; datasheet p. 22). Intensity (Wave Intensity, 1–100 %, 50 % by default) and grading: the more often a screen point is hit, the brighter it is; the DHO900 has 256 intensity levels and the Color Grade color scale (datasheet pp. 4, 22; User Guide pp. 248–249).
What it is for. To see not one record but statistics: edge jitter, a rare glitch, noise. Model: 10 000 waveforms, an edge jittering with a standard deviation of 2 ns — on the screen a band 15.7 ns wide (about six deviations, 12 ns).
Where the rare gets lost. One waveform in 1000 is different: over 10 000 passes the main trace gets 9990 hits, the rare one — 10. With brightness proportional to hits, the rare trace gets 0.26 of a level out of 255 — that is, 0, and it is invisible. If brightness follows the logarithm of the hits, the rare trace gets 66 levels out of 255 and is visible. How the DHO900 computes its grading — the documents do not say; Infinite and Color Grade show rare events for sure.
Mistake. Leaving Infinite on after changing the circuit — old and new are mixed on the screen. In Roll the DHO900 has no persistence (User Guide p. 74).
36г.19 Pitfalls
The signal "disappeared". The offset is left over from last time, and the signal is past the edge of the screen — that is, past the edge of the ADC (36г.1, 36г.4). Press POSITION.
Amplitude off by 10 times. The probe is at 1:10, the menu at 1X: 0.33 V instead of 3.3 V (36г.8). The DHO900 default is 1X.
A negative logic zero. AC coupling: 10 % PWM shows from −0.33 to 2.97 V (36г.5). Logic — DC only.
No ringing, yet the board fails. BW Limit 20 MHz: 105 MHz ringing keeps 19 % of its amplitude, a 5 ns edge looks like 18.2 ns (36г.7).
A clean 5 Hz square wave instead of 100 kHz PWM. Aliasing with shallow memory: 50 kSa/s at 20 ms/div (36г.15). Peak or deeper memory.
The glitch comes and goes. Normal on a slow time base: 20 ns with a sample every 200 ns gets into 10 % of records (36г.16). Peak.
Averaging "cured" the glitch. Average divides an asynchronous pulse by the number of records: 2 V became 0.11 V (36г.16).
A pin into a 50 Ω input. 66 mA — 2.6 times the pin limit (36г.6). The DHO900 has no such input; on other instruments, check the switch.
Waiting for a glitch at the screen. At 10 ns/div the instrument is blind 99.7 % of the time: a glitch 10 times a second shows up on average after 33.33 s (36г.17).
36г.20 Summary
- The screen is the ADC range (on the DHO900 ±4 divisions): what is past the edge is not in memory. Stretch the signal over the screen: on one division out of eight, three bits are lost — a 12-bit ADC becomes a 9-bit one.
- Offset subtracts the DC level before the ADC; on the DHO900 its limit depends on the scale (up to ±20 V at 500 mV/div). Beyond that — AC coupling, but not for logic levels.
- The DHO900 has only 1 MΩ; 50 Ω only with an external terminator. A 50 Ω input overloads a microcontroller pin.
- BW Limit 20 MHz reduces noise by a factor of 0.287 and hides ringing.
- The probe ratio, the unit and inversion in the menu are a common source of "the instrument is lying".
- Sample rate = memory ÷ window. The default 10 k keeps the full rate only up to 800 ns/div, 50 M — up to 4 ms/div. Zoom adds no points.
- Aliasing draws a stable false wave; changing the time base, Peak and deep memory expose it.
- Normal — the honest shape, Peak — short pulses and protection from aliasing, Average — noise of a repeating signal, High Res (not on the DHO900) — noise of a single shot.
- Between records the instrument is blind; UltraAcquire raises the live time from 0.3 % to 10 % at 10 ns/div. Persistence and intensity grading show rare events — if the brightness is not linear.
Next: section 36д "Oscilloscope, part 2: triggering — every kind of trigger and when to use which" — how to catch the right moment: edge, pulse width, runt, timeout, window and bus triggers.