 Embedded HandbookApps
112. Observability: logs, metrics, alerts
The stand from section 111 works — but how do you know it is working right now, at three in the morning, and that the device in the far workshop has not overheated? Observability answers the three questions of the on-call engineer: what happened — logs, how bad is it — metrics, when to call a human — alerts. This section adds all three to the telemetry receiver and tests them with a scenario: a device overheats, reboots, goes silent, and then the receiver itself goes down. Everything is assembled in Compose from real Prometheus v3.14.0 and Alertmanager v0.34.0.
Terms used in the documentation
Term Meaning observability being able to see what the system is doing from its outputs structured logging a log with structure: one line is one JSON record log rotation log rotation: old files are deleted metric, time series a metric, a series of values over time counter / gauge counter (only grows) / gauge (any value) label a series label: dev="A1"scrape collecting metrics by polling alerting rule a rule that raises an alert firing / resolved the alert is active / the alert is cleared on-call the engineer on duty
112.1 The data path
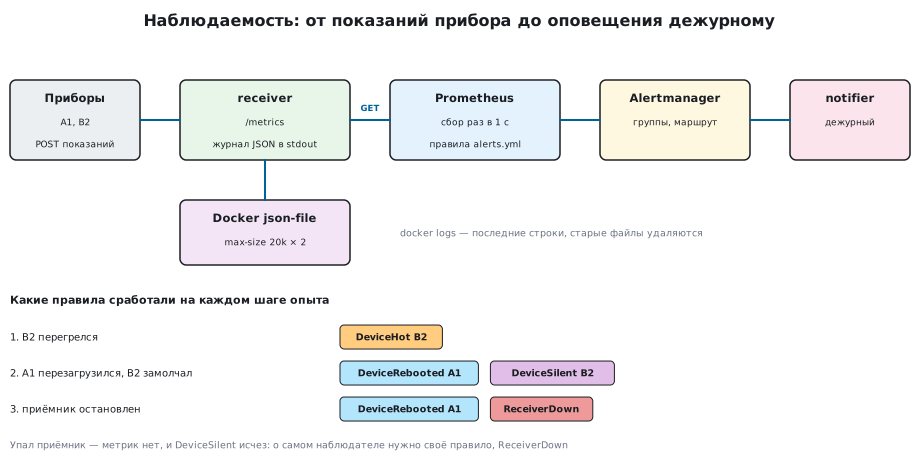
- The receiver writes every event as a JSON line to standard output; Docker
stores these lines in files and returns them with the
docker logscommand. - The receiver exposes counters and the latest readings at
/metrics; Prometheus polls it once a second and keeps the history. - Prometheus evaluates the rules; a rule that fires goes to Alertmanager,
which groups the alerts and sends them to the on-call engineer — in the experiment this is a separate
service,
notifier.
Each link can be replaced — Loki instead of docker logs, VictoriaMetrics
instead of Prometheus, a messenger instead of notifier — and the design stays
the same.
112.2 The log: one line, one event
A line like "received from A1, 21.5" is easy on the eye, but you cannot filter it or count it. The receiver writes a JSON record:
static void log_json(const char *level, const char *event, const char *extra)
{
    printf("{\"ts\":%.3f,\"level\":\"%s\",\"event\":\"%s\"%s%s}\n", now(), level, event, extra[0] ? "," : "", extra);
    fflush(stdout);
}
In the log it looks like this:
{"ts":1789230267.718,"level":"info","event":"telemetry","dev":"A1","t":21.5,"up":100}
{"ts":1789230271.973,"level":"warn","event":"alert","alert":"DeviceHot","status":"firing"}
Every record has a time, a level and an event name, followed by the event fields.
Such lines are filtered by field (event = telemetry, dev = B2),
not by regular expressions. Write to standard output, not to a file
inside the container: the file disappears together with the container, while the output is collected
by Docker. fflush is needed because output to a pipe is block-buffered,
and without it the lines arrive late.
112.3 The log must not eat the disk
By default Docker keeps a container's log without any limit — a receiver that writes a line for every request will fill the server's disk within months. The limit is set in Compose:
x-logging: &logging
  driver: json-file
  options:
    max-size: "20k"
    max-file: "2"
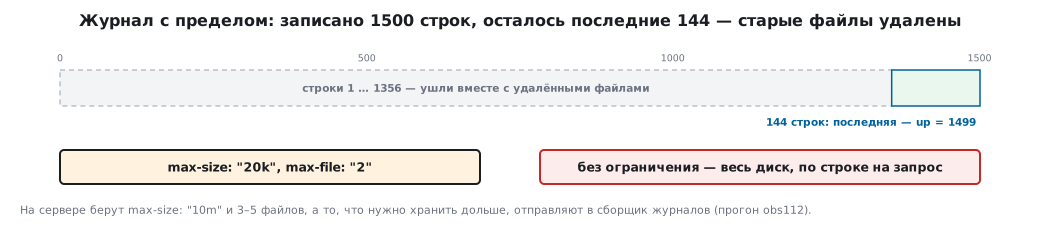
In the experiment the receiver wrote 1500 telemetry lines, and docker logs returned
only the last ones — about a hundred and a half (144 in the experiment): the rest went away with the deleted files. The last
line has up = 1499, that is, it is the newest one. On a server people use
max-size: "10m" and three to five files; whatever must be kept longer
is sent to a log collector.
112.4 Metrics: counters and gauges
A metric is a number with a name and labels that Prometheus reads on request. The receiver returns them as plain text:
telemetry_lines_total 2
telemetry_bad_total 1
device_temperature_celsius{dev="B2"} 65.0
device_uptime_seconds{dev="A1"} 100
Two kinds that must not be confused:
- a counter (
_total) only grows: lines accepted, packets rejected, responses with code 200. On its own it says little — what matters is how fast it grows; - a gauge is the current value: temperature, uptime, the time of the last message.
The name carries the unit (_celsius, _seconds), the labels carry what you
will group by (dev). Labels must not grow without limit: the device
number is a good label, a time or an error text is a bad one — every new
value creates a new series.
In the experiment the line "garbage" got a 400 response and was counted in telemetry_bad_total:
an error counter is as important as a success counter.
112.5 What the device should report
The receiver knows only what it has been sent. The minimum worth sending in every message:
- uptime since the last reset — when it drops, you see a reboot;
- reset cause — watchdog, power, software reset (section 12.4);
- error counters — transmission retries, CRC errors, buffer overflows;
- stack headroom and free memory, if there is an RTOS (section 35);
- the readings themselves — temperature, supply voltage.
The message arrives regularly, even when the readings have not changed: silence is a signal too, and there is a rule about it below.
112.6 Prometheus: scraping and queries
global:
  scrape_interval: 1s
  evaluation_interval: 1s
scrape_configs:
  - job_name: receiver
    static_configs:
      - targets: ["receiver:8080"]
Once a second Prometheus reads /metrics and stores each value
with a timestamp. On a server 15–30 seconds is enough; one second in the experiment
is so you do not have to wait. For each target Prometheus creates the up series itself: 1 — the target
responded, 0 — it did not.
PromQL queries that were run in the experiment:
| Query | What it computes | Result |
|---|---|---|
rate(telemetry_lines_total[10s]) |
lines per second | about 1 |
max_over_time(device_temperature_celsius{dev="B2"}[1m]) |
maximum of B2 over a minute | 65 |
resets(device_uptime_seconds{dev="A1"}[1m]) |
reboots of A1 over a minute | 1 |
rate() handles a counter reset by itself: after the receiver restarted,
the counter started over — 1500 after 1500 new lines — and the rate did not
"drop" below zero.
112.7 Alerting rules
      - alert: DeviceHot
        expr: device_temperature_celsius > 60
        for: 2s
      - alert: DeviceSilent
        expr: time() - device_last_seen_seconds > 10
      - alert: ReceiverDown
        expr: up{job="receiver"} == 0
        for: 3s
expr is the condition, for is how long it must hold before the rule
fires. Without for a single sensor spike would wake the on-call engineer; with it
the rule is first "pending", then "firing". DeviceRebooted is built
on resets() — an alert for every reboot of a device.
The most important rule is about the watcher itself. When the receiver is stopped, there are no device
metrics, and the rules about current values go quiet: in the experiment DeviceSilent
disappeared at the same moment — there was nothing left to compare. DeviceRebooted still
held: it looks at a minute of history. Without ReceiverDown a dead receiver
would look like "all quiet".
But ReceiverDown is also a rule of the same Prometheus. If Prometheus itself goes down,
or Alertmanager, the whole server or the link to the on-call engineer — not a single
alert arrives, and silence again looks like "all quiet". The last level is
a rule that is always firing: expr: vector(1), usually named Watchdog;
promtool test rules confirms that it fires even when there are no metrics at all.
Alertmanager repeats it, say, once a minute to an external service, and that service
wakes the on-call engineer itself when the repeats stop arriving. Plus a check
of the server's availability from another machine.
112.8 Alertmanager: groups, routes, "resolved"
route:
  receiver: notifier
  group_by: ["alertname", "dev"]
  group_wait: 1s
receivers:
  - name: notifier
    webhook_configs:
      - url: http://notifier:8080/api/alert
        send_resolved: true
Alertmanager collects alerts into groups — one message about ten
silent devices instead of ten — sends them along a route and repeats them
if the problem has not gone away. send_resolved also sends the all-clear: in the experiment
notifier received DeviceHot with status firing, and when B2 cooled down —
the same DeviceHot with status resolved.
Alerts go to notifier, not to the receiver itself: ReceiverDown got through
precisely because the recipient is a different service. The alert channel must not
depend on what it is watching.
112.9 The experiment step by step
| Step | What was done | What fired |
|---|---|---|
| 1 | A1 and B2 send readings, B2 reports 65.0 °C | DeviceHot for B2 |
| 2 | A1 rebooted and keeps sending, B2 cooled down and went silent | DeviceRebooted for A1, DeviceSilent for B2; DeviceHot resolved |
| 3 | the receiver is stopped | ReceiverDown; DeviceSilent disappeared together with the metrics, DeviceRebooted holds |
The alerts that reached the on-call engineer through Alertmanager were DeviceHot and DeviceSilent — both
fired and were resolved — plus DeviceRebooted and ReceiverDown. DeviceSilent was resolved
not because B2 spoke again, but because the metrics disappeared: an all-clear
does not always mean "fixed".
112.10 Pitfalls
The server's disk filled up with logs. The log has no max-size. Set
a limit in Compose or in the Docker settings.
Log lines arrive in batches and late. The output is buffered.
fflush(stdout) after each write, or line buffering.
Prometheus ate the memory. The labels contain a time, an error text or a request number: every value is a new series. Labels must have only a limited set of values.
The on-call engineer is woken by spikes. The rule has no for. The condition must hold.
The receiver went down — and silence. The rules cover only the devices. You need a rule
up == 0 about the receiver itself.
The alert about the failure never came. It was sent by the service that failed. The alert channel must be separate.
The counter graph looks like a "saw". The raw counter is plotted, and it resets
on a restart. Plot rate().
112.11 Summary
- The log is one JSON line per event to standard output; the limit
max-sizeandmax-file: out of 1500 lines about a hundred and a half of the last ones remained. - Metrics:
_totalcounters and gauges with the unit in the name; labels only with a limited set of values. - PromQL:
rate()— the rate of a counter that accounts for resets,max_over_time()— the maximum over a window,resets()— device reboots. - Rules:
foragainst spikes, a separate rule about the watcher itself (ReceiverDown): without data the rules about current values go quiet. - Alertmanager groups alerts, sends
resolvedand delivers to a channel that does not depend on the service being watched.
This section completes part XII "Networks and DevOps for the engineer".
Full sources
obs.c — the telemetry receiver with a JSON log and metrics for Prometheus.
/* Раздел 112: приёмник телеметрии, за которым можно наблюдать.
 *
 *   POST /api/telemetry   тело «dev=A1 t=21.5 up=120» — показания прибора
 *   POST /api/alert       приём оповещений от Alertmanager (роль notifier)
 *   GET  /metrics         счётчики и показания в текстовом формате Prometheus
 *   GET  /health          проверка здоровья
 *   obs --check           проверка здоровья изнутри образа FROM scratch
 *
 * Каждое событие — одна строка JSON в stdout: её собирает Docker, а читают
 * docker logs и любые сборщики журналов. Один процесс, одно соединение за раз. */
#define _GNU_SOURCE /* strcasestr */
#include <arpa/inet.h>
#include <netinet/in.h>
#include <stdio.h>
#include <stdlib.h>
#include <string.h>
#include <sys/socket.h>
#include <time.h>
#include <unistd.h>

#define MAX_DEV 8

struct device {
    char name[8];
    double temp;
    double uptime;
    double last_seen;
};

static struct device dev[MAX_DEV];
static int n_dev;
static unsigned long lines_total, alerts_total, bad_total;
static unsigned long http_total[6]; /* 200, 400, 404, 413, 500, прочие */

static double now(void)
{
    struct timespec ts;
    clock_gettime(CLOCK_REALTIME, &ts);
    return (double)ts.tv_sec + ts.tv_nsec / 1e9;
}

static void log_json(const char *level, const char *event, const char *extra)
{
    printf("{\"ts\":%.3f,\"level\":\"%s\",\"event\":\"%s\"%s%s}\n", now(), level, event, extra[0] ? "," : "", extra);
    fflush(stdout);
}

static void reply(int fd, int code, const char *type, const char *body)
{
    static const int codes[] = { 200, 400, 404, 413, 500 };
    const char *text = code == 200 ? "OK" : code == 400 ? "Bad Request" : code == 404 ? "Not Found"
                     : code == 413 ? "Payload Too Large" : "Internal Server Error";
    char head[256];
    int k = 5;
    for (int i = 0; i < 5; i++)
        if (codes[i] == code)
            k = i;
    http_total[k]++;
    int n = snprintf(head, sizeof head,
                     "HTTP/1.1 %d %s\r\nContent-Type: %s\r\nContent-Length: %zu\r\nConnection: close\r\n\r\n",
                     code, text, type, strlen(body));
    if (write(fd, head, (size_t)n) < 0 || write(fd, body, strlen(body)) < 0)
        return;
}

static struct device *find_dev(const char *name)
{
    for (int i = 0; i < n_dev; i++)
        if (strcmp(dev[i].name, name) == 0)
            return &dev[i];
    if (n_dev == MAX_DEV)
        return NULL;
    snprintf(dev[n_dev].name, sizeof dev[n_dev].name, "%s", name);
    return &dev[n_dev++];
}

/* «dev=A1 t=21.5 up=120»: 0 — принято, -1 — строка не разобрана. */
static int take_telemetry(const char *body)
{
    char name[8];
    double t, up;
    if (sscanf(body, "dev=%7[A-Za-z0-9] t=%lf up=%lf", name, &t, &up) != 3)
        return -1;
    struct device *d = find_dev(name);
    if (!d)
        return -1;
    d->temp = t;
    d->uptime = up;
    d->last_seen = now();
    lines_total++;
    char extra[96];
    snprintf(extra, sizeof extra, "\"dev\":\"%s\",\"t\":%.1f,\"up\":%.0f", name, t, up);
    log_json("info", "telemetry", extra);
    return 0;
}

static void metrics(char *out, size_t cap)
{
    static const char *const code_name[] = { "200", "400", "404", "413", "500", "other" };
    size_t n = 0;
    n += (size_t)snprintf(out + n, cap - n,
                          "# HELP telemetry_lines_total Lines of telemetry accepted.\n"
                          "# TYPE telemetry_lines_total counter\ntelemetry_lines_total %lu\n"
                          "# TYPE telemetry_bad_total counter\ntelemetry_bad_total %lu\n"
                          "# TYPE alerts_received_total counter\nalerts_received_total %lu\n"
                          "# TYPE http_requests_total counter\n",
                          lines_total, bad_total, alerts_total);
    for (int i = 0; i < 6; i++)
        n += (size_t)snprintf(out + n, cap - n, "http_requests_total{code=\"%s\"} %lu\n", code_name[i], http_total[i]);
    n += (size_t)snprintf(out + n, cap - n, "# TYPE device_temperature_celsius gauge\n");
    for (int i = 0; i < n_dev; i++)
        n += (size_t)snprintf(out + n, cap - n, "device_temperature_celsius{dev=\"%s\"} %.1f\n", dev[i].name, dev[i].temp);
    n += (size_t)snprintf(out + n, cap - n, "# TYPE device_uptime_seconds gauge\n");
    for (int i = 0; i < n_dev; i++)
        n += (size_t)snprintf(out + n, cap - n, "device_uptime_seconds{dev=\"%s\"} %.0f\n", dev[i].name, dev[i].uptime);
    n += (size_t)snprintf(out + n, cap - n, "# TYPE device_last_seen_seconds gauge\n");
    for (int i = 0; i < n_dev; i++)
        n += (size_t)snprintf(out + n, cap - n, "device_last_seen_seconds{dev=\"%s\"} %.3f\n", dev[i].name,
                              dev[i].last_seen);
}

/* Из тела оповещения Alertmanager берём статус и имя правила — для журнала. */
static void take_alert(const char *body)
{
    char status[16] = "?", name[48] = "?";
    const char *p = strstr(body, "\"status\":\"");
    if (p)
        sscanf(p + 10, "%15[a-z]", status);
    p = strstr(body, "\"alertname\":\"");
    if (p)
        sscanf(p + 13, "%47[A-Za-z0-9_]", name);
    alerts_total++;
    char extra[96];
    snprintf(extra, sizeof extra, "\"alert\":\"%s\",\"status\":\"%s\"", name, status);
    log_json("warn", "alert", extra);
}

static void serve(int fd)
{
    static char req[16384], out[8192];
    ssize_t got = 0, r;
    char *end = NULL;
    long want = 0;

    while (got < (ssize_t)sizeof req - 1 && (r = read(fd, req + got, sizeof req - 1 - (size_t)got)) > 0) {
        got += r;
        req[got] = 0;
        if (!end && (end = strstr(req, "\r\n\r\n")) != NULL) {
            const char *cl = strcasestr(req, "\r\nContent-Length:");
            want = cl ? atol(cl + 17) : 0;
        }
        if (end && got - (end + 4 - req) >= want)
            break;
    }
    if (!end) {
        reply(fd, 400, "text/plain", "bad request\n");
        return;
    }
    const char *body = end + 4;
    if (strncmp(req, "POST /api/telemetry ", 20) == 0) {
        if (want > 256) {
            reply(fd, 413, "text/plain", "too large\n");
        } else if (take_telemetry(body) == 0) {
            reply(fd, 200, "text/plain", "ok\n");
        } else {
            bad_total++;
            log_json("error", "bad_telemetry", "");
            reply(fd, 400, "text/plain", "bad telemetry\n");
        }
    } else if (strncmp(req, "POST /api/alert ", 16) == 0) {
        take_alert(body);
        reply(fd, 200, "text/plain", "ok\n");
    } else if (strncmp(req, "GET /metrics ", 13) == 0) {
        metrics(out, sizeof out);
        reply(fd, 200, "text/plain; version=0.0.4", out);
    } else if (strncmp(req, "GET /health ", 12) == 0) {
        reply(fd, 200, "text/plain", "ok\n");
    } else {
        reply(fd, 404, "text/plain", "not found\n");
    }
}

static int self_check(void)
{
    int s = socket(AF_INET, SOCK_STREAM, 0);
    struct sockaddr_in a = { .sin_family = AF_INET, .sin_port = htons(8080), .sin_addr.s_addr = htonl(INADDR_LOOPBACK) };
    const char q[] = "GET /health HTTP/1.1\r\nHost: self\r\n\r\n";
    char ans[64] = { 0 };
    if (s < 0 || connect(s, (struct sockaddr *)&a, sizeof a) < 0 || write(s, q, sizeof q - 1) < 0
        || read(s, ans, sizeof ans - 1) <= 0)
        return 1;
    close(s);
    return strncmp(ans, "HTTP/1.1 200", 12) == 0 ? 0 : 1;
}

int main(int argc, char **argv)
{
    if (argc > 1 && strcmp(argv[1], "--check") == 0)
        return self_check();
    int s = socket(AF_INET, SOCK_STREAM, 0), one = 1;
    struct sockaddr_in a = { .sin_family = AF_INET, .sin_port = htons(8080), .sin_addr.s_addr = htonl(INADDR_ANY) };
    setsockopt(s, SOL_SOCKET, SO_REUSEADDR, &one, sizeof one);
    if (bind(s, (struct sockaddr *)&a, sizeof a) < 0 || listen(s, 64) < 0) {
        perror("bind");
        return 1;
    }
    log_json("info", "start", "");
    for (;;) {
        int c = accept(s, NULL, NULL);
        if (c < 0)
            continue;
        serve(c);
        close(c);
    }
}
prometheus.yml — metric scraping and the connection of rules and Alertmanager.
# Раздел 112: сбор метрик раз в секунду (в опыте — чтобы не ждать; на сервере — 15–30 с).
global:
  scrape_interval: 1s
  evaluation_interval: 1s

rule_files:
  - /etc/prometheus/alerts.yml

alerting:
  alertmanagers:
    - static_configs:
        - targets: ["alertmanager:9093"]

scrape_configs:
  - job_name: receiver
    static_configs:
      - targets: ["receiver:8080"]
alerts.yml — the alerting rules.
# Раздел 112: правила оповещений. Порог и длительность — в правиле, а не в голове.
groups:
  - name: devices
    rules:
      - alert: ReceiverDown
        expr: up{job="receiver"} == 0
        for: 3s
        labels:
          severity: critical
        annotations:
          summary: "Приёмник телеметрии не отвечает"

      - alert: DeviceHot
        expr: device_temperature_celsius > 60
        for: 2s
        labels:
          severity: warning
        annotations:
          summary: "Прибор {{ $labels.dev }}: {{ $value }} °C"

      - alert: DeviceSilent
        expr: time() - device_last_seen_seconds > 10
        labels:
          severity: warning
        annotations:
          summary: "Прибор {{ $labels.dev }} молчит больше 10 с"

      - alert: DeviceRebooted
        expr: resets(device_uptime_seconds[1m]) > 0
        labels:
          severity: info
        annotations:
          summary: "Прибор {{ $labels.dev }} перезагрузился"
alertmanager.yml — where alerts go and how they are grouped.
# Раздел 112: куда уходят оповещения. В опыте — в отдельный сервис notifier;
# на сервере — в почту, мессенджер или телефон дежурного.
route:
  receiver: notifier
  group_by: ["alertname", "dev"]
  group_wait: 1s
  group_interval: 2s
  repeat_interval: 1h

receivers:
  - name: notifier
    webhook_configs:
      - url: http://notifier:8080/api/alert
        send_resolved: true
Next: section 113 "Ada and SPARK: Alire, GNAT for Cortex-M, proof".