 Embedded HandbookApps
183. Schedules and people: the team, the late project, three-point estimates
Firmware differs from desktop software in that you cannot release it "partially": the board either works at the customer's site or it does not. That is why schedules here are calculated, not assigned. This section is about three things that break any plan: communication inside the team, helping a late project, and a one-sided "how long will it take" estimate.
The numbers come from the model _verify/soft183/schedule.py with explicit assumptions;
randomness appears only in the schedule simulation, and it is fixed by a seed, so
the run reproduces number for number.
Terms used in the documentation
Term Meaning effort, man-hours the amount of work, in person-hours communication overhead time spent on coordination instead of work ramp-up the time a newcomer needs to reach full output critical path the longest chain of dependent tasks three-point estimate an estimate given as three numbers optimistic / most likely / pessimistic the best-case, most likely and worst-case estimate Monte-Carlo simulation many runs with random task durations merge bias the delay caused by paths converging percentile, P90 the date met with 90 % probability milestone a checkpoint in the schedule
183.1 Why a team does not add up
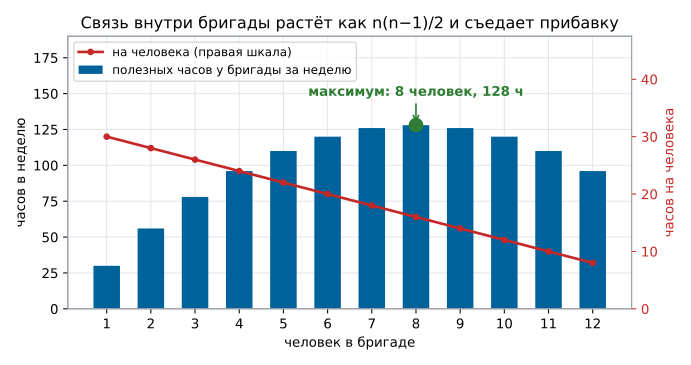
Assumption: each person gives 30 useful hours a week, and each
pair of people spends 4 hours a week on coordination — calls, discussions,
reading someone else's code. A team of n people has exactly n(n−1)/2 pairs:
P(n) = 30·n − 4·n(n−1)/2
| People | Useful hours per week | Per person |
|---|---|---|
| 1 | 30 | 30.0 |
| 2 | 56 | 28.0 |
| 3 | 78 | 26.0 |
| 4 | 96 | 24.0 |
| 6 | 120 | 20.0 |
| 8 | 128 | 16.0 |
| 10 | 120 | 12.0 |
| 12 | 96 | 8.0 |
The maximum is 8 people, 128 hours a week. The ninth and tenth person add nothing, and the twelfth pushes the team back to the level of four. The numbers depend on the assumptions, but the shape of the curve does not: linear growth minus quadratic losses always gives a hump.
The practical conclusion is not "work alone" but cut the links: if the team splits into two groups of four with one agreed interface between them, there are 6 + 6 pairs inside the groups instead of 28. For firmware such interfaces are natural: module boundaries, the frame format, the register map.
183.2 Helping a late project
Assumptions: 2400 useful hours of work remain, the team has 6 people, a newcomer reaches full output in 4 weeks (in the first week giving a quarter of the norm) and all that time takes 8 hours a week from a mentor.
| What was done in week 8 | Finish |
|---|---|
| nothing changed | 20 weeks |
| added 2 people | 21 weeks |
| added 3 people | 22 weeks |
| added 6 people | 27 weeks |
Every addition pushes back the finish. After ramp-up two newcomers really do speed the team up — 128 hours a week against 120; three give only 126, and six slow it down for good: 12 people give 96 hours (183.1). The ramp-up losses and the new communication links eat more than the extra people bring, and the closer to the end people are added, the less time remains to win back the investment.
What works instead of adding people: cut the scope (which requirements move to the next version), take off the team everything that does not lead to delivery, and accept the new date — that is, exactly what people are reluctant to do.
183.3 Three-point estimate
A single number, "two weeks", is a promise with no probability attached.
A three-point estimate gives an optimistic o, a most likely m and
a pessimistic p; the duration is then treated as having a triangular
distribution with mean (o + m + p) / 3 and variance
(o² + m² + p² − o·m − o·p − m·p) / 18.
| Task | o | m | p | Mean |
|---|---|---|---|---|
| requirements | 1 | 2 | 4 | 2.33 |
| schematic design | 4 | 5 | 8 | 5.67 |
| board | 3 | 4 | 6 | 4.33 |
| firmware skeleton | 1 | 2 | 3 | 2.00 |
| drivers | 3 | 5 | 9 | 5.67 |
| bench and tests | 4 | 5 | 8 | 5.67 |
| integration | 1 | 2 | 5 | 2.67 |
| acceptance | 1 | 2 | 4 | 2.33 |
What matters is not only the middle but also the spread: the drivers range from 3 to 9 weeks, the skeleton only from 1 to 3. A task with a wide spread is dangerous even if its mean is small.
183.4 Three chains and a 15-week deadline
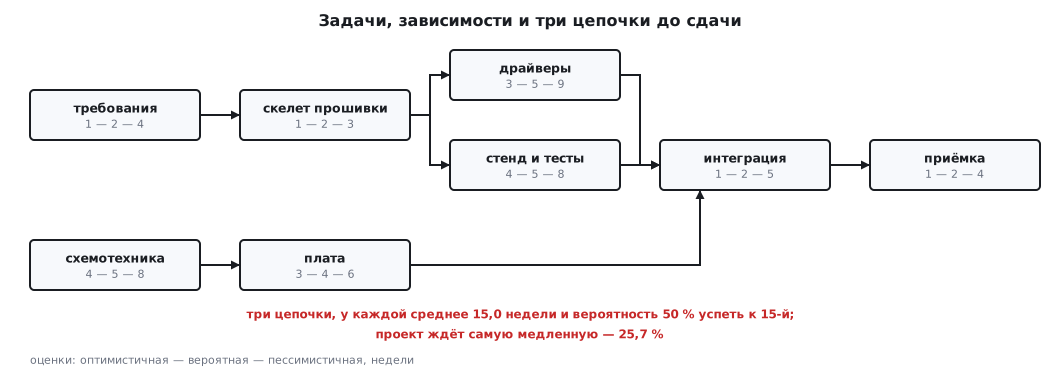
In our project three chains lead to delivery:
| Chain | Mean | Spread | Within 15 weeks |
|---|---|---|---|
| requirements → skeleton → drivers → integration → acceptance | 15.0 | ±1.8 | 50 % |
| requirements → skeleton → bench and tests → integration → acceptance | 15.0 | ±1.5 | 50 % |
| schematic design → board → integration → acceptance | 15.0 | ±1.5 | 50 % |
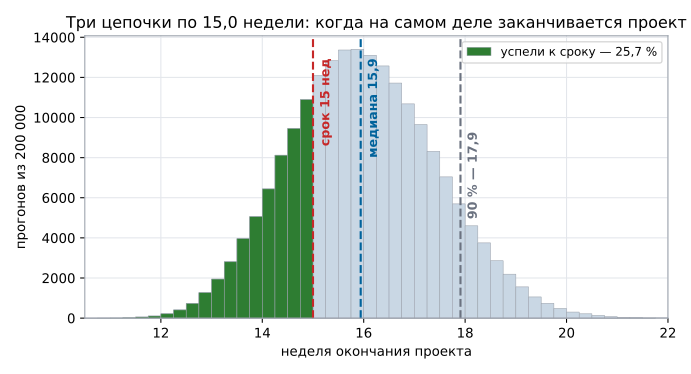
Each one on its own makes it in half the cases. But delivery requires all three at once to make it, and running the whole schedule 200000 times (seed 2026) gives a different picture:
| Quantity | Value |
|---|---|
| mean finish | 16.0 weeks |
| median | 15.9 weeks |
| date with 90 % confidence | 17.9 weeks |
| share of runs within 15 weeks | 25.7 % |
This is the merge bias: the project waits for the slowest of the chains, so its finish is worse than that of each of them. The mean finish of the project is 16.0 weeks, even though each chain has a mean of exactly 15.0.
Hence a working technique: promise a percentile, not the mean. If you need a date you will meet nine times out of ten, it is 17.9 weeks, not 15. The three-week difference has two parts. The larger one is the spread of the tasks themselves: even a single chain with a spread of ±1.8 gives 17.4 weeks at the 90 % level. The remaining 0.5 week is the price of having three paths; to the mean the merging adds a whole week — 16.0 against 15.0. That is why a percentile is promised even when there is only one path.
183.5 What to do about it
- Cut links, do not hire people. Two groups of four with one agreed interface spend communication on 12 pairs instead of 28.
- Cut scope, not time. A trimmed requirement saves hours honestly; a promised date without the hours does not.
- Keep the spread visible. A task "drivers: from 3 to 9 weeks" needs an early check: write a driver skeleton in the first week to narrow the estimate.
- Recalculate the critical path every week. A chain that was not critical becomes critical after the first delay — in the model all three chains are equal, and the leader changes from run to run.
- Promise a percentile. "17.9 weeks with 90 % probability" is a promise you can keep; "15 weeks" with the same tasks is met in a quarter of the cases.
183.6 Pitfalls
"Let's add people and catch up." The model gives 21 weeks instead of 20 with two newcomers and 27 with six. Help helps at the start of a project, not right before delivery.
The estimate is given by someone who will not do the work. Then it is not an estimate but a wish; such an estimate has no three points.
The sum of the means is passed off as the project date. Merging paths has its own price: three chains of 15.0 weeks each give a project with a mean of 16.0 and a probability of finishing by week 15 of 25.7 %.
The reserve is hidden inside the tasks. A hidden margin is always used up (work expands to fill the time available), while a common reserve at the end is used only when needed.
The plan is not recalculated. A schedule that was not updated after the first delay shows the past, not the future.
183.7 Summary
- Communication losses grow as
n(n−1)/2: with 30 hours per person and 4 hours per pair, the team peaks at 8 people and 128 hours a week, and 12 people give as much as 4. - Adding people to a late project pushes the date back: 21 and 27 weeks instead of 20 with two and six newcomers.
- A three-point estimate gives the mean and the spread; tasks with a wide spread are checked earlier than the rest.
- Merging paths costs more than it seems: three chains of 15.0 weeks each give a 25.7 % probability of finishing by week 15 and 17.9 weeks at the 90 % level — against 17.4 for a single chain; a percentile is promised even with one path.
Next: section 184 "Firmware testing: levels, coverage, mutations, sanitizers".