 Embedded HandbookApps
33б. FreeRTOS tracing: trace macros and a task timeline
In section 35.3 you see the kernel as a snapshot: uxTaskGetSystemState tells you
which state each task is in right now and how much CPU it has used. In section 26.9
run-time accounting showed the CPU shares of the tasks. Neither answers the
question "when": who preempted whom, how long a task sat ready,
why a periodic task started 3 ms late today. This section builds
your own tracer: the trace… macros that the kernel leaves empty
write every context switch and every resource take into a ring buffer with a
timestamp; the debugger fetches the ring, and a PC program draws a task
timeline. On a test run you can see priority inversion (and how a
mutex removes it), jitter of a periodic task and starvation; the cost
of the tracer itself is measured too.
Builds on: section 26 (tasks, priorities, run-time accounting — 26.9), 28.6
(critical sections and interrupts), 30.5 (priority inversion and
inheritance — not repeated here, only measured), 33.3
(configUSE_TRACE_FACILITY), 33а (starvation of the watchdog task), 35.3
(task snapshot, the cycle counter DWT->CYCCNT), 21 and 21а (the SWO and
RTT channels that carry the ring off the board). The kernel is FreeRTOS 10.5.1 from the
CMSIS-FreeRTOS pack, port ARM_CM4F (github.com/FreeRTOS/FreeRTOS-Kernel,
MIT license). The experiment runs on QEMU 7.2, machine netduinoplus2 (STM32F405,
Cortex-M4F, like the F407); the same firmware is also built for the F407 with DWT->CYCCNT.
Terms used in the documentation
Term Meaning trace hook macros ( traceTASK_SWITCHED_IN, …)trace macros: empty slots in the kernel for your own code event record one event entry: time, code, task, payload flight recorder mode new entries overwrite the oldest ones timeline, task swimlanes a time diagram with one lane per task ready-to-run latency delay from "became ready" to "got the CPU" probe effect the measurement itself costs cycles
33б.1 The path: from a kernel macro to a diagram on the PC
An event travels in four steps:
- A macro in the kernel.
tasks.candqueue.ccontain calls totraceTASK_SWITCHED_IN(),traceQUEUE_SEND(pxQueue)and others. By default they are empty. Once defined inFreeRTOSConfig.h, they expand inside the kernel, so they can see its internal variables. - A record in the ring. Your own
trace_evstores 8 bytes: timestamp, event code, task number, payload. The ring sits in RAM, 1024 records. - Upload. The debugger reads the ring from memory: in the experiment it is gdb at a breakpoint, on a board it is RTT (21а) or a stream over SWO (21).
- Parsing. The PC program
tdiag.pyturns the records into segments "the task ran from … to …" and draws the diagram.
Here is what a run of the scenario from 30.5 produced: three tasks, H waits for a resource owned by L, and M cuts in. The figure is built from two uploaded rings — one with a binary semaphore and one with a mutex:
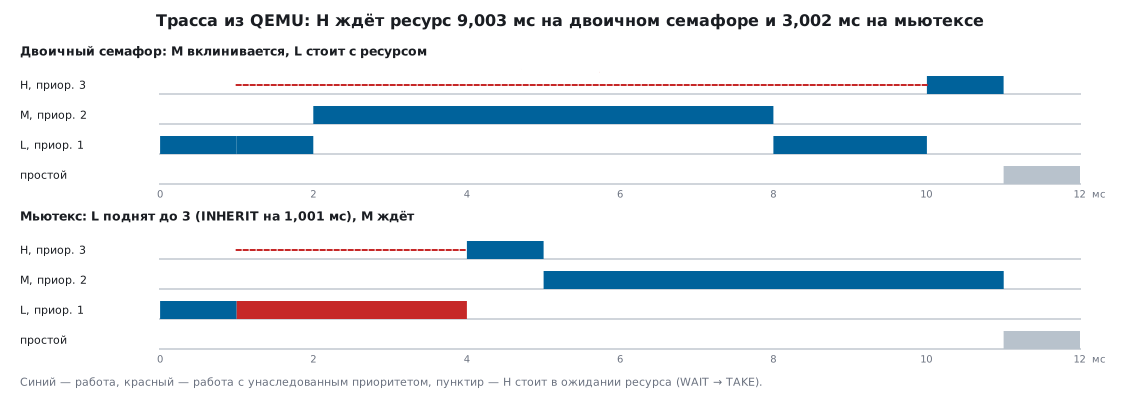
The numbers in the figure come from the ring, not from a model: 9.003 ms of waiting for H versus 3.002. The scenario and the analysis are in 33б.5.
33б.2 Kernel macros: which exist and where they are called
FreeRTOS.h of version 10.5.1 has 89 trace… macros, and each one
is wrapped like this (quoted without the kernel comment, MIT license):
#ifndef traceTASK_SWITCHED_IN
    #define traceTASK_SWITCHED_IN()
#endif
If you defined your own earlier, the kernel takes it. For a timeline a few are enough:
| Macro | Where it is called | What is visible inside |
|---|---|---|
traceTASK_SWITCHED_IN() |
vTaskSwitchContext — after a task is selected; and in vTaskStartScheduler for the first one |
pxCurrentTCB — the new task |
traceTASK_SWITCHED_OUT() |
same place, before the selection | pxCurrentTCB — the outgoing task |
traceTASK_INCREMENT_TICK(xTickCount) |
xTaskIncrementTick — in the tick interrupt |
the tick count before the increment |
traceMOVED_TASK_TO_READY_STATE(pxTCB) |
prvAddTaskToReadyList: creation, wake-up, inheritance |
the task that became ready |
traceQUEUE_SEND(pxQueue), traceQUEUE_RECEIVE(pxQueue) |
xQueueGenericSend, xQueueReceive, xQueueSemaphoreTake — a successful write and read |
the queue; semaphores and mutexes are queues too |
traceBLOCKING_ON_QUEUE_RECEIVE(pxQueue) |
the task is about to block | the queue |
traceTASK_PRIORITY_INHERIT(holder, prio) |
xTaskPriorityInherit |
the mutex holder and the new priority |
traceTASK_PRIORITY_DISINHERIT(holder, prio) |
xTaskPriorityDisinherit |
the holder and its original priority |
traceTASK_DELAY_UNTIL(xTimeToWake) |
xTaskDelayUntil (vTaskDelayUntil is a macro over it) and vTaskPlaceOnEventListRestricted |
the wake-up tick |
traceTASK_CREATE(pxNewTCB) |
prvAddNewTaskToReadyList |
name and number of the new task |
The task number is the field uxTCBNumber, the queue number is uxQueueNumber
(vQueueSetQueueNumber). Both exist only with
configUSE_TRACE_FACILITY = 1 (33.3): tasks are numbered 1, 2, … in
order of creation, and the idle task gets the next number. Your own macros
(trace_rec.h):
#if TRACE_ON
#define traceTASK_CREATE(t)               trace_name((t)->uxTCBNumber, (t)->pcTaskName)
#define traceTASK_SWITCHED_IN()           trace_in(pxCurrentTCB->uxTCBNumber, pxCurrentTCB->uxPriority)
#define traceMOVED_TASK_TO_READY_STATE(t) trace_ev(TR_READY, (t)->uxTCBNumber, (t)->uxPriority)
#define traceTASK_INCREMENT_TICK(n)       trace_ev(TR_TICK, trace_cur, (n) + 1u)
#define traceQUEUE_SEND(q)                trace_ev(TR_GIVE, trace_cur, (q)->uxQueueNumber)
#define traceQUEUE_RECEIVE(q)             trace_ev(TR_TAKE, trace_cur, (q)->uxQueueNumber)
#define traceBLOCKING_ON_QUEUE_RECEIVE(q) trace_ev(TR_WAIT, trace_cur, (q)->uxQueueNumber)
#define traceTASK_PRIORITY_INHERIT(t, p)  trace_ev(TR_INHERIT, (t)->uxTCBNumber, (p))
#define traceTASK_PRIORITY_DISINHERIT(t, p) trace_ev(TR_DISINHERIT, (t)->uxTCBNumber, (p))
#define traceTASK_DELAY_UNTIL(w)          trace_ev(TR_DELAY, trace_cur, (w))
#endif
Two savings. traceTASK_SWITCHED_OUT is not recorded: a task leaving is
the next one arriving, and its time is already there. pxCurrentTCB and the task control block type
TCB_t are declared only in tasks.c and are not visible in queue.c — so
traceTASK_SWITCHED_IN stores the number of the current task in trace_cur, and
queue events take it from there.
33б.3 Writing to the ring: 8 bytes, a timestamp, no kernel locks
A record is a uint32_t timestamp, an event code byte, a task number
byte and a 16-bit payload (priority, queue number, tick). The ring size is a
power of two, and the index is the low bits of the record counter
(trace_rec.c):
void trace_ev(uint32_t ev, uint32_t task, uint32_t arg)
{
    uint32_t pm = irq_save();               /* часть макросов зовётся при открытых прерываниях */
    if (trace_buf.on) {
        trace_rec_t *r = &trace_buf.ring[trace_buf.head & (TRACE_N - 1u)];
        r->ts = TRACE_NOW();
        r->ev = (uint8_t)ev;
        r->task = (uint8_t)task;
        r->arg = (uint16_t)arg;
        trace_buf.head++;                   /* кольцо: новая запись затирает самую старую */
    }
    irq_restore(pm);
}

void trace_in(uint32_t task, uint32_t prio)
{
    trace_cur = task;
    trace_ev(TR_IN, task, prio);
}
Why interrupts are disabled. The context switch and the tick run with
BASEPRI raised, queue events run inside taskENTER_CRITICAL. But
the kernel calls traceTASK_DELAY_UNTIL and traceBLOCKING_ON_QUEUE_RECEIVE
with the scheduler suspended and interrupts enabled: a tick can
arrive in the middle of a record, and two records land in one slot. PRIMASK for
the duration of the record costs three instructions (mrs, cpsid, msr) and protects against any
interrupt, including those more urgent than the kernel threshold (28.6). You must not call kernel functions inside
trace_ev: it is itself called from the kernel.
Timestamp. On the F407 it is the cycle counter DWT->CYCCNT (35.3): 32
bits at 168 MHz, wrapping every 25.6 s; the PC program unwraps
overflows by itself as long as neighbouring records are less than one wrap apart. QEMU
does not model DWT — in the experiment CYCCNT read as zero. Instead,
TIM2 with prescaler 1 is used there: with -icount shift=0 it adds one for
each executed instruction. Check: the work_ms loop for 0.1 ms is 33333
iterations of three instructions, 99999 instructions, and TIM2 counted 100151 (including the call).
A tick millisecond in QEMU is 10⁶ instructions; all times below are in
milliseconds of this count, and costs are in instructions:
void trace_clock_start(void)
{
#ifdef TRACE_QEMU
    RCC_APB1ENR |= 1u;                      /* TIM2EN */
    TIM2_PSC = 0u;
    TIM2_ARR = 0xFFFFFFFFu;                 /* TIM2 32-битный: свободный счёт */
    TIM2_EGR = 1u;
    TIM2_CR1 = 1u;
#else
    CoreDebug->DEMCR |= CoreDebug_DEMCR_TRCENA_Msk;
    DWT->CYCCNT = 0u;
    DWT->CTRL |= DWT_CTRL_CYCCNTENA_Msk;
#endif
}
Flight recorder mode. The ring does not stop when it is full:
record 1025 goes into the place of the first one. After a failure it holds
the last thousand events before it — exactly what you need. The head field
counts all records, so the PC program knows how many were overwritten.
Task names are stored separately, by number; traceTASK_CREATE writes
them once.
33б.4 Upload and parsing on the PC
The ring together with the header and the names is one structure trace_buf of
8304 bytes. In the experiment the firmware, after finishing the scenario, turns recording off and
calls the empty function trace_done; a gdb breakpoint sits on it, and the
whole structure is dumped to a file:
target remote :1234
break trace_done
continue
dump binary value inv_sem.bin trace_buf
On a board the same is done without stopping. With RTT (21а) the ring becomes
an "up" channel, and the debugger reads it on the fly. With SWO (21) each
record is sent to an ITM channel directly from trace_ev — then the ring in RAM
is not needed, but the line must keep up: 8 bytes per event. How to configure
both channels is covered in their own sections and is not repeated here.
tdiag.py parses the file: header <4I, names, records <IBBH. Records
before the first TR_IN are dropped — they were made before the counter was reset when
the scheduler started. The scale comes from the ticks themselves: the mean distance between
TR_TICK records is one millisecond (in the experiment 999999 counts).
The main job is to turn the event stream into run segments:
    runs, cur, since = [], None, None
    for t, e in zip(ts, ev):
        if e[1] == 1:
            if cur is not None:
                runs.append((cur, ms(since), ms(t), prio))
            cur, since, prio = e[2], t, e[3]
Each TR_IN closes the segment of the previous task and opens a new one. A
TR_WAIT → TR_TAKE pair gives the resource wait time,
TR_READY → TR_IN gives the "ready → running" latency, and the sum of segments gives the
CPU share. The diagram is printed as text with a 0.25 ms cell (# — the task
runs, ^ — it runs with a borrowed priority), or as SVG (--svg).
33б.5 What the trace shows: inversion, jitter, starvation
Priority inversion and the mutex
The scenario is the same as in 30.5, tasks from app.c:
static void task_l(void *arg)
{
    (void)arg;
    xSemaphoreTake(lock, portMAX_DELAY);
    work_ms(40);                            /* 4 мс с ресурсом */
    xSemaphoreGive(lock);
    vTaskSuspend(NULL);
}

static void task_h(void *arg)
{
    (void)arg;
    vTaskDelay(pdMS_TO_TICKS(1));
    xSemaphoreTake(lock, portMAX_DELAY);
    work_ms(10);                            /* 1 мс с ресурсом */
    xSemaphoreGive(lock);
    vTaskSuspend(NULL);
}

static void task_m(void *arg)
{
    (void)arg;
    vTaskDelay(pdMS_TO_TICKS(2));
    work_ms(60);                            /* 6 мс своей работы, ресурс не нужен */
    vTaskSuspend(NULL);
}
work_ms is a busy loop of three instructions per iteration, with no waiting: the run
time does not depend on whether the task was preempted. Priorities: H is 3,
M is 2, L is 1. lock is either a binary semaphore or a mutex. Parsing the ring
with the semaphore:
ожидание ресурса H: 1.000 … 10.003 мс = 9.003 мс
  пока ждала, работали: M 6.001 мс, L 3.002 мс
H      |                                        ####    |
M      |        ########################                |
L      |########                        ########        |
IDLE   |                                            ####|
мс      0   1   2   3   4   5   6   7   8   9   10  11  12
H requests the resource at ms 1 and waits 9.003 ms: of that, 6.001 ms is spent running M,
which does not need the resource at all. With the mutex the ring contains two new
events — INHERIT at 1.001 ms (L raised to 3) and DISINHERIT at
4.002 ms:
ожидание ресурса H: 1.000 … 4.003 мс = 3.002 мс
  пока ждала, работали: L 3.002 мс
H      |                ####                            |
L      |####^^^^^^^^^^^^                                |
M      |                    ########################    |
IDLE   |                                            ####|
мс      0   1   2   3   4   5   6   7   8   9   10  11  12
H waits exactly for the rest of L's work with the resource, 3.002 ms. The cost of inheritance is visible too: M became ready at ms 2 and got the CPU only 3.003 ms later. The CPU shares are the same in both runs (H 1.001, L 4.001, M 6.001 ms out of 20 ms) — you cannot see the inversion in them, but you see it in the timing at once.
Jitter and starvation
The load scenario, 200 ms:
| Task | Priority | What it does |
|---|---|---|
| burst | 3 | a burst of work every 7 ms: 1; 3; 0.5; 2 ms in rotation |
| period | 2 | every 5 ms (vTaskDelayUntil) 0.5 ms of work |
| poll | 2 | from ms 100 to ms 160 polls a flag in a loop without yielding the CPU |
| logger | 1 | every 10 ms 0.5 ms of work |
"Ready → running" latency from the ring (the tick makes a task ready,
and it starts running at TR_IN):
| period | logger | |
|---|---|---|
| best | 156 instructions | 0.5 ms — waits for period |
| average | 0.372 ms | 5.348 ms |
| worst | 3.001 ms, at ms 70 | 60.521 ms, ready at ms 100 |
Jitter. 156 instructions is the path from the TR_READY record in the tick
interrupt to TR_IN in PendSV: this is what the switch itself costs. Everything above that is
someone else's work: at ms 70 period and burst woke up together, and period
waited for the three-millisecond burst. From ms 100 to ms 160 poll
adds to this: it has the same priority, and the kernel shares the CPU with it
tick by tick — period, due at ms 100, started at ms 102.
Starvation. logger became ready at ms 100 and got the CPU at ms 160.521 — when poll stopped. A piece of the diagram (0.5 ms cell):
burst  |      ######        #             ####          ##          |
period |#             #      #        #         #         #         |
poll   |            ## #####  ######## ###    ## #######   #########|
logger |                                                            |
IDLE   | #####                                                      |
мс      95        100       105       110       115       120       125
The logger lane is empty; the idle task did not run from ms 98 to ms 164.523. After ms 160 logger
ran all seven missed periods back to back — 3.5 ms of work up to
ms 164.523: vTaskDelayUntil does not wait when the wake-up time has already passed. The idle task starved too — which means
neither the idle hook nor tickless sleep (33.5) would have run.
The fixes: period moves to priority 4, above burst, and poll yields the CPU
with vTaskDelay(1) after each poll:
period |#         #         #         #         #         #         |
burst  |      #### ##        #            ####          ##          |
poll   |             .. . .   . . . .  ..     .  .. . .    .. . . . |
logger |             #.                #.                  #.       |
IDLE   | #####        ######  ########  ##    ## #######    ########|
мс      95        100       105       110       115       120       125
period now starts 156…304 instructions after its tick, and logger waits no more than 3.501 ms. But the trace shows the price as well: burst, which period now preempts, got a latency of up to 0.501 ms instead of 230 instructions. Jitter does not disappear — it is moved to a task for which it is harmless.
33б.6 What the tracer costs and what can replace it
The cost is measured with the same QEMU instruction counter:
| What | Without trace | With trace | Source |
|---|---|---|---|
one trace_ev record including the call |
— | 26 instructions | 100 calls: 2805 versus 205 for the empty loop |
task switch (taskYIELD there and back, 2000 times) |
61.5 instructions | 90.5 | 123008 and 181008 instructions |
same with run-time accounting (configGENERATE_RUN_TIME_STATS) |
81.5 | — | 163008 instructions |
| RAM | — | 8304 bytes | ring 1024 × 8, names 12 × 8, header 16 |
| Flash memory | 7372 bytes | 7836 | +464 bytes: functions and macros in the kernel |
The trace adds 29 instructions to a switch, run-time accounting adds 20. In the load scenario there are 2.58 records per millisecond: a ring of 1024 records holds roughly 400 ms of history, and 518 records per run cost about 15 thousand instructions out of 200 million, less than 0.01%. This is the probe effect, and it is not zero: every switch under the trace is 29 instructions longer. A race that depends on a dozen cycles can be hidden by the tracer — see the pitfalls below.
A cheap alternative is kernel run-time accounting. It is enabled with three
lines (FreeRTOSConfig.h), and the time source is the same counter:
#if STATS_ON
#define configGENERATE_RUN_TIME_STATS           1
#define configUSE_STATS_FORMATTING_FUNCTIONS    1
#define portCONFIGURE_TIMER_FOR_RUN_TIME_STATS() trace_clock_zero()
#define portGET_RUN_TIME_COUNTER_VALUE()        trace_now()
#else
#define configGENERATE_RUN_TIME_STATS           0
#endif
In the load scenario vTaskGetRunTimeStats printed 19512558 counts and 9% for period,
40012518 and 20% for poll, and
85454239 and 42% for idle. The ring gave 19.513, 40.013 and 85.454 ms — a match
to the microsecond: both count with one counter on the same
switches. The kernel rounds percentages down (9% versus 9.8%).
| Kernel run-time accounting | Your own trace | |
|---|---|---|
| RAM | 4 bytes per task and 8 for the kernel | 8304 bytes for 1024 events |
| task switch | +20 instructions | +29 instructions |
| Flash memory | +64 bytes for counting; with printing via vTaskGetRunTimeStats and sprintf — +4324 |
+464 bytes |
| answers | "how much CPU each task has" | "who, when and why" |
| inversion in the experiment | not visible: the shares are the same | 9.003 versus 3.002 ms |
The usual practice: the product keeps run-time accounting (without printing — it reads
uxTaskGetSystemState, 35.3), and the trace is enabled by a build option when you need to
understand the order of events.
33б.7 Pitfalls
CYCCNT is always zero. TRCENA in CoreDebug->DEMCR is not set, or
you are running in QEMU: there is no DWT there, and the counter reads as zero. All records have
the same timestamp — the diagram collapses into a point.
Two records in one slot. Recording without disabling interrupts: the kernel calls some
macros with interrupts enabled, and the tick cuts in between
reading and incrementing head. One record is lost, another is duplicated.
Calling the kernel from a macro. xTaskGetCurrentTaskHandle, printf,
writing to a queue — from inside vTaskSwitchContext and the tick interrupt.
That is recursion into the kernel or waiting where waiting is not allowed. From a macro, use only
your own variables and registers.
A slow record stretches time. snprintf in the switch macro means
hundreds of instructions on every switch, and the trace now shows a different
program. A record is a fixed 8 bytes; parsing happens on the PC.
The ring was overwritten before you stopped it. 2.58 records per ms gives 400 ms
of history; with frequent interrupts that write to queues, less.
Stop recording at the moment of the event (trace_stop in the fault
handler or in the watchdog task, 33а), not when you notice it.
All task numbers are zero. configUSE_TRACE_FACILITY = 0: the fields
uxTCBNumber and uxQueueNumber do not exist, and the macros will not compile — or
will compile with a wrong field if you write them without relying on the kernel.
A mutex without a number. vQueueSetQueueNumber was not called: events of all
queues have number 0, and you cannot tell a resource from a message queue.
Run-time stats are garbage after a minute. The kernel accumulates the 32-bit counter
without overflow protection (26.9); for the trace this is not a problem — it stores
differences — but the percentages of vTaskGetRunTimeStats are wrong after a wrap.
The race disappeared under the trace. The probe effect: 29 instructions per switch shift the timing. If it disappeared, it depends on timing; hunt for it by changing the load, not by turning the trace off.
33б.8 Summary
- The FreeRTOS 10.5.1 kernel leaves 89 empty
trace…macros; once defined inFreeRTOSConfig.h, they seepxCurrentTCBandpxQueue. For a timelineSWITCHED_IN,MOVED_TASK_TO_READY_STATE,INCREMENT_TICK, queue events and inheritance are enough. - A record is 8 bytes in a ring of 1024, under
PRIMASK, timestamped withDWT->CYCCNT(in QEMU, TIM2 counting instructions). The ring with names takes 8304 bytes of RAM, +464 bytes of Flash, 26 instructions per record, +29 per switch. - Upload via gdb (
dump binary value), RTT or SWO; parsing on the PC turnsTR_INinto run segments and event pairs into waits. - Inversion in the run: H waits 9.003 ms on a binary semaphore, of which 6.001 ms is spent running M; with a mutex, 3.002 ms, only the rest of L.
- Jitter of period is up to 3.001 ms from a burst of a higher-priority task; starvation of logger is 60.521 ms behind poll, which does not yield the CPU. After the fixes: 156…304 instructions and 3.501 ms.
- Kernel run-time accounting is cheaper (+20 instructions per switch) and gives the same shares, but not the order of events: it does not show inversion.
Full source code
trace_rec.h — the tracer: kernel macros and the record format.
/* Раздел 33б: лёгкий трассировщик FreeRTOS — события ядра в кольцо по 8 байт.
 * Подключается в конце FreeRTOSConfig.h: макросы trace… ядра раскрываются внутри tasks.c и queue.c,
 * поэтому им видны pxCurrentTCB, pxQueue и поля TCB (нужен configUSE_TRACE_FACILITY = 1). */
#ifndef TRACE_REC_H
#define TRACE_REC_H

#include <stdint.h>

#ifndef TRACE_ON
#define TRACE_ON 1
#endif
#define TRACE_N      1024u                  /* записей в кольце, степень двойки */
#define TRACE_TASKS  12u                    /* сколько имён задач помнить */
#define TRACE_NAME   8u                     /* = configMAX_TASK_NAME_LEN */

enum {                                      /* код события — байт ev записи */
    TR_IN = 1,          /* задача получила процессор; arg — её текущий приоритет */
    TR_READY,           /* задача стала готовой; task — она, arg — приоритет */
    TR_TICK,            /* тик; arg — младшие 16 бит счёта тиков */
    TR_GIVE,            /* запись в очередь или отдача семафора/мьютекса; arg — номер очереди */
    TR_TAKE,            /* чтение из очереди или взятие; arg — номер очереди */
    TR_WAIT,            /* задача встала ждать очередь; arg — номер очереди */
    TR_INHERIT,         /* держатель мьютекса task поднят до arg */
    TR_DISINHERIT,      /* держатель мьютекса task вернулся к arg */
    TR_DELAY,           /* задача уснула до тика arg */
    TR_MARK             /* метка приложения; arg — её код */
};

typedef struct {
    uint32_t ts;                            /* метка времени: DWT->CYCCNT, в QEMU — TIM2->CNT */
    uint8_t ev;                             /* код события TR_… */
    uint8_t task;                           /* номер задачи uxTCBNumber: 1, 2, … по порядку создания */
    uint16_t arg;                           /* смысл зависит от события */
} trace_rec_t;

typedef struct {
    uint32_t magic;                         /* 'TR33' — читатель на ПК узнаёт блок */
    uint32_t head;                          /* сколько записей сделано всего; в кольце — последние TRACE_N */
    uint32_t n;                             /* TRACE_N */
    uint32_t on;                            /* писать или нет */
    char name[TRACE_TASKS][TRACE_NAME];     /* имя задачи по её номеру */
    trace_rec_t ring[TRACE_N];
} trace_buf_t;

extern trace_buf_t trace_buf;
extern volatile uint32_t trace_cur;         /* номер задачи, что сейчас работает */

uint32_t trace_now(void);
void trace_clock_start(void);
void trace_clock_zero(void);
void trace_ev(uint32_t ev, uint32_t task, uint32_t arg);
void trace_in(uint32_t task, uint32_t prio);
void trace_name(uint32_t task, const char *name);
void trace_start(void);
void trace_stop(void);
void trace_done(void);                      /* точка останова для отладчика: кольцо готово */

#if TRACE_ON
#define traceTASK_CREATE(t)               trace_name((t)->uxTCBNumber, (t)->pcTaskName)
#define traceTASK_SWITCHED_IN()           trace_in(pxCurrentTCB->uxTCBNumber, pxCurrentTCB->uxPriority)
#define traceMOVED_TASK_TO_READY_STATE(t) trace_ev(TR_READY, (t)->uxTCBNumber, (t)->uxPriority)
#define traceTASK_INCREMENT_TICK(n)       trace_ev(TR_TICK, trace_cur, (n) + 1u)
#define traceQUEUE_SEND(q)                trace_ev(TR_GIVE, trace_cur, (q)->uxQueueNumber)
#define traceQUEUE_RECEIVE(q)             trace_ev(TR_TAKE, trace_cur, (q)->uxQueueNumber)
#define traceBLOCKING_ON_QUEUE_RECEIVE(q) trace_ev(TR_WAIT, trace_cur, (q)->uxQueueNumber)
#define traceTASK_PRIORITY_INHERIT(t, p)  trace_ev(TR_INHERIT, (t)->uxTCBNumber, (p))
#define traceTASK_PRIORITY_DISINHERIT(t, p) trace_ev(TR_DISINHERIT, (t)->uxTCBNumber, (p))
#define traceTASK_DELAY_UNTIL(w)          trace_ev(TR_DELAY, trace_cur, (w))
#endif

#endif
trace_rec.c — writing events into the ring.
/* Раздел 33б: запись событий ядра в кольцо. Метка времени — счётчик тактов DWT->CYCCNT на камне;
 * в QEMU он читается нулём, поэтому там (TRACE_QEMU) — TIM2 с делителем 1: при -icount shift=0
 * он прибавляет единицу на каждую выполненную команду. */
#include "trace_rec.h"

#ifdef TRACE_QEMU
#define RCC_APB1ENR (*(volatile uint32_t *)0x40023840)
#define TIM2_CR1    (*(volatile uint32_t *)0x40000000)
#define TIM2_EGR    (*(volatile uint32_t *)0x40000014)
#define TIM2_CNT    (*(volatile uint32_t *)0x40000024)
#define TIM2_PSC    (*(volatile uint32_t *)0x40000028)
#define TIM2_ARR    (*(volatile uint32_t *)0x4000002C)
#define TRACE_NOW() TIM2_CNT
#else
#include "stm32f4xx.h"
#define TRACE_NOW() DWT->CYCCNT
#endif

trace_buf_t trace_buf;
volatile uint32_t trace_cur;

uint32_t trace_now(void)
{
    return TRACE_NOW();
}

void trace_clock_start(void)
{
#ifdef TRACE_QEMU
    RCC_APB1ENR |= 1u;                      /* TIM2EN */
    TIM2_PSC = 0u;
    TIM2_ARR = 0xFFFFFFFFu;                 /* TIM2 32-битный: свободный счёт */
    TIM2_EGR = 1u;
    TIM2_CR1 = 1u;
#else
    CoreDebug->DEMCR |= CoreDebug_DEMCR_TRCENA_Msk;
    DWT->CYCCNT = 0u;
    DWT->CTRL |= DWT_CTRL_CYCCNTENA_Msk;
#endif
}

void trace_clock_zero(void)                 /* старт планировщика: учёт времени задач — с нуля */
{
#ifdef TRACE_QEMU
    TIM2_CNT = 0u;
#else
    DWT->CYCCNT = 0u;
#endif
}

static inline uint32_t irq_save(void)
{
    uint32_t pm;
    __asm volatile("mrs %0, primask\n cpsid i" : "=r"(pm)::"memory");
    return pm;
}

static inline void irq_restore(uint32_t pm)
{
    __asm volatile("msr primask, %0" ::"r"(pm) : "memory");
}

void trace_ev(uint32_t ev, uint32_t task, uint32_t arg)
{
    uint32_t pm = irq_save();               /* часть макросов зовётся при открытых прерываниях */
    if (trace_buf.on) {
        trace_rec_t *r = &trace_buf.ring[trace_buf.head & (TRACE_N - 1u)];
        r->ts = TRACE_NOW();
        r->ev = (uint8_t)ev;
        r->task = (uint8_t)task;
        r->arg = (uint16_t)arg;
        trace_buf.head++;                   /* кольцо: новая запись затирает самую старую */
    }
    irq_restore(pm);
}

void trace_in(uint32_t task, uint32_t prio)
{
    trace_cur = task;
    trace_ev(TR_IN, task, prio);
}

void trace_name(uint32_t task, const char *name)
{
    if (task < TRACE_TASKS)
        for (uint32_t i = 0; i < TRACE_NAME; i++)
            trace_buf.name[task][i] = name[i];
}

void trace_start(void)
{
    trace_buf.magic = 0x33335254u;          /* 'TR33' */
    trace_buf.n = TRACE_N;
    trace_buf.head = 0u;
    trace_buf.on = 1u;
}

void trace_stop(void)
{
    trace_buf.on = 0u;
}

__attribute__((noinline)) void trace_done(void)
{
    __asm volatile("" ::: "memory");        /* здесь отладчик забирает trace_buf */
}
FreeRTOSConfig.h — kernel settings with tracing and run-time accounting.
/* Раздел 33б: FreeRTOS 10.5.1, порт ARM_CM4F, QEMU netduinoplus2 (STM32F405, Cortex-M4F) и F407.
 * TRACE_ON — макросы trace… ядра пишут в кольцо; STATS_ON — учёт времени задач ядром. */
#ifndef FREERTOS_CONFIG_H
#define FREERTOS_CONFIG_H

#ifndef STATS_ON
#define STATS_ON 1
#endif

#define configUSE_PREEMPTION                    1
#define configUSE_TIME_SLICING                  1
#define configUSE_PORT_OPTIMISED_TASK_SELECTION 0
#define configCPU_CLOCK_HZ                      168000000UL
#define configTICK_RATE_HZ                      1000
#define configMAX_PRIORITIES                    6
#define configMINIMAL_STACK_SIZE                256
#define configTOTAL_HEAP_SIZE                   (32 * 1024)
#define configMAX_TASK_NAME_LEN                 8
#define configUSE_16_BIT_TICKS                  0
#define configIDLE_SHOULD_YIELD                 1
#define configUSE_MUTEXES                       1
#define configSUPPORT_DYNAMIC_ALLOCATION        1
#define configSUPPORT_STATIC_ALLOCATION         0
#define configUSE_IDLE_HOOK                     0
#define configUSE_TICK_HOOK                     0
#define configCHECK_FOR_STACK_OVERFLOW          0
#define configUSE_TIMERS                        0
#define configUSE_CO_ROUTINES                   0
#define configUSE_TRACE_FACILITY                1   /* номера задач и очередей для трассировки */

#if STATS_ON
#define configGENERATE_RUN_TIME_STATS           1
#define configUSE_STATS_FORMATTING_FUNCTIONS    1
#define portCONFIGURE_TIMER_FOR_RUN_TIME_STATS() trace_clock_zero()
#define portGET_RUN_TIME_COUNTER_VALUE()        trace_now()
#else
#define configGENERATE_RUN_TIME_STATS           0
#endif

/* число бит приоритета у QEMU иное, чем у STM32 (4), поэтому configPRIO_BITS не задаём */
#define configKERNEL_INTERRUPT_PRIORITY         (15 << 4)
#define configMAX_SYSCALL_INTERRUPT_PRIORITY    (5 << 4)

#define INCLUDE_vTaskDelay                      1
#define INCLUDE_vTaskDelayUntil                 1
#define INCLUDE_vTaskSuspend                    1

void my_assert(const char *file, int line);
#define configASSERT(x) if (!(x)) my_assert(__FILE__, __LINE__)

#include "trace_rec.h"

#endif
app.c — scenarios: inversion, jitter, starvation, cost.
/* Раздел 33б: сценарии для трассировки, QEMU netduinoplus2 с -icount shift=0 (1 мс = 10^6 команд).
 * SCEN 1 — инверсия приоритетов на двоичном семафоре, 2 — то же на мьютексе,
 * 3 — нагрузка: дрожание периодической задачи и голодание, 4 — то же после исправлений,
 * 5 — цена: запись в кольцо и переключение задач. */
#include <stdint.h>
#include "FreeRTOS.h"
#include "task.h"
#include "semphr.h"

#ifndef SCEN
#define SCEN 1
#endif

void puts1(const char *s);
void putdec(uint32_t v);

#define LOOPS_PER_MS 333333u                /* цикл work — 3 команды на оборот (проверено трассой) */

__attribute__((noinline)) static void work_ms(uint32_t tenth)   /* работа без ожидания: tenth — десятые доли мс */
{
    for (uint32_t i = 0; i < tenth * (LOOPS_PER_MS / 10u); i++)
        __asm volatile("");
}

#if SCEN != 5
static void finish(uint32_t run_ms)
{
    vTaskDelay(pdMS_TO_TICKS(run_ms));
    trace_stop();
#if configGENERATE_RUN_TIME_STATS
    static char buf[512];
    vTaskGetRunTimeStats(buf);
    puts1("stats:\r\n");
    puts1(buf);
#endif
    puts1("head=");
    putdec(trace_buf.head);
    puts1("\r\ndone\r\n");
    trace_done();
    for (;;)
        vTaskDelay(1000);
}
#endif

#if SCEN == 1 || SCEN == 2
/* ── инверсия: H ждёт ресурс, который держит L, а M ни при чём ── */
static SemaphoreHandle_t lock;

static void task_l(void *arg)
{
    (void)arg;
    xSemaphoreTake(lock, portMAX_DELAY);
    work_ms(40);                            /* 4 мс с ресурсом */
    xSemaphoreGive(lock);
    vTaskSuspend(NULL);
}

static void task_h(void *arg)
{
    (void)arg;
    vTaskDelay(pdMS_TO_TICKS(1));
    xSemaphoreTake(lock, portMAX_DELAY);
    work_ms(10);                            /* 1 мс с ресурсом */
    xSemaphoreGive(lock);
    vTaskSuspend(NULL);
}

static void task_m(void *arg)
{
    (void)arg;
    vTaskDelay(pdMS_TO_TICKS(2));
    work_ms(60);                            /* 6 мс своей работы, ресурс не нужен */
    vTaskSuspend(NULL);
}

static void task_ctl(void *arg)
{
    (void)arg;
    finish(20);
}

static void setup(void)
{
#if SCEN == 1
    lock = xSemaphoreCreateBinary();
    xSemaphoreGive(lock);
#else
    lock = xSemaphoreCreateMutex();
#endif
    vQueueSetQueueNumber(lock, 1);
    xTaskCreate(task_ctl, "ctl", 256, NULL, 5, NULL);
    xTaskCreate(task_h, "H", 256, NULL, 3, NULL);
    xTaskCreate(task_m, "M", 256, NULL, 2, NULL);
    xTaskCreate(task_l, "L", 256, NULL, 1, NULL);
}
#endif

#if SCEN == 3 || SCEN == 4
/* ── нагрузка: burst мешает period, poll морит голодом logger ── */
#define FIX (SCEN == 4)

static void task_burst(void *arg)           /* приоритет 3: раз в 7 мс вспышка 1; 3; 0,5; 2 мс */
{
    static const uint8_t len[4] = {10, 30, 5, 20};
    TickType_t wake = xTaskGetTickCount();
    (void)arg;
    for (uint32_t k = 0;; k++) {
        vTaskDelayUntil(&wake, pdMS_TO_TICKS(7));
        work_ms(len[k % 4u]);
    }
}

static void task_period(void *arg)          /* раз в 5 мс, 0,5 мс работы */
{
    TickType_t wake = xTaskGetTickCount();
    (void)arg;
    for (;;) {
        vTaskDelayUntil(&wake, pdMS_TO_TICKS(5));
        work_ms(5);
    }
}

static void task_poll(void *arg)            /* приоритет 2: с 100-й по 160-ю мс опрашивает флаг */
{
    (void)arg;
    vTaskDelay(pdMS_TO_TICKS(100));
    while (xTaskGetTickCount() < pdMS_TO_TICKS(160)) {
        work_ms(1);
#if FIX
        vTaskDelay(1);                      /* исправление: отдать процессор между опросами */
#endif
    }
    vTaskSuspend(NULL);
}

static void task_logger(void *arg)          /* приоритет 1: раз в 10 мс, 0,5 мс работы */
{
    TickType_t wake = xTaskGetTickCount();
    (void)arg;
    for (;;) {
        vTaskDelayUntil(&wake, pdMS_TO_TICKS(10));
        work_ms(5);
    }
}

static void task_ctl(void *arg)
{
    (void)arg;
    finish(200);
}

static void setup(void)
{
    xTaskCreate(task_ctl, "ctl", 512, NULL, 5, NULL);
    xTaskCreate(task_burst, "burst", 256, NULL, 3, NULL);
    xTaskCreate(task_period, "period", 256, NULL, FIX ? 4 : 2, NULL);
    xTaskCreate(task_poll, "poll", 256, NULL, 2, NULL);
    xTaskCreate(task_logger, "logger", 256, NULL, 1, NULL);
}
#endif

#if SCEN == 5
/* ── цена: 1000 оборотов «A уступает B, B уступает A» ── */
#define ROUNDS 1000u

static void task_b(void *arg)
{
    (void)arg;
    for (;;)
        taskYIELD();
}

static void task_a(void *arg)
{
    (void)arg;
    uint32_t t0 = trace_now();
    for (uint32_t i = 0; i < ROUNDS; i++)
        taskYIELD();
    uint32_t t1 = trace_now();
    puts1("yield: ");
    putdec(t1 - t0);
    puts1(" commands for ");
    putdec(2u * ROUNDS);
    puts1(" switches\r\n");
    trace_stop();
    puts1("head=");
    putdec(trace_buf.head);
    puts1("\r\ndone\r\n");
    trace_done();
    vTaskSuspend(NULL);
}

static void cost_of_record(void)
{
    trace_start();
    uint32_t t0 = trace_now();
    for (uint32_t i = 0; i < 100u; i++)
        __asm volatile("" ::: "memory");
    uint32_t t1 = trace_now();
    for (uint32_t i = 0; i < 100u; i++)
        trace_ev(TR_MARK, 0, i);
    uint32_t t2 = trace_now();
    puts1("loop100: ");
    putdec(t1 - t0);
    puts1(" record100: ");
    putdec(t2 - t1);
    puts1("\r\n");
}

static void setup(void)
{
    cost_of_record();
    xTaskCreate(task_a, "A", 256, NULL, 1, NULL);
    xTaskCreate(task_b, "B", 256, NULL, 1, NULL);
}
#endif

int main(void)
{
    trace_clock_start();
    puts1("scen=");
    putdec(SCEN);
    puts1(" trace=");
    putdec(TRACE_ON);
    puts1(" stats=");
    putdec(configGENERATE_RUN_TIME_STATS);
#ifdef TRACE_QEMU
    *(volatile uint32_t *)0xE000EDFC |= 1u << 24;          /* DEMCR.TRCENA */
    *(volatile uint32_t *)0xE0001000 |= 1u;                /* DWT_CTRL.CYCCNTENA */
    uint32_t c0 = *(volatile uint32_t *)0xE0001004, t0 = trace_now();
    work_ms(1);
    puts1(" cyccnt=");
    putdec(*(volatile uint32_t *)0xE0001004 - c0);         /* QEMU 7.2: DWT нет, читается нулём */
    puts1(" tim2=");
    putdec(trace_now() - t0);                              /* 0,1 мс работы: 3 команды × 33333 оборота */
#endif
    puts1("\r\n");
    setup();
    trace_start();                          /* имена задач уже записаны: trace_name не смотрит на on */
    vTaskStartScheduler();
    puts1("no scheduler\r\n");
    for (;;) {
    }
}
tdiag.py — parsing the ring on the PC.
# -*- coding: utf-8 -*-
"""Раздел 33б: разбор кольца трассировщика FreeRTOS на ПК.

python tdiag.py <файл.bin> [--svg out.svg] [--from мс --to мс] [--step мс]

Файл — trace_buf, выгруженный отладчиком (gdb: dump binary value f.bin trace_buf). Печатает временную
диаграмму задач текстом (одна клетка — 0,25 мс), отрезки работы, ожидания ресурса, задержку
«стала готовой → получила процессор» и долю процессора каждой задачи."""
import os
import struct
import sys

EV = {1: "IN", 2: "READY", 3: "TICK", 4: "GIVE", 5: "TAKE", 6: "WAIT", 7: "INHERIT", 8: "DISINHERIT", 9: "DELAY", 10: "MARK"}
TRACE_TASKS, TRACE_NAME = 12, 8


def load(path):
    raw = open(path, "rb").read()
    magic, head, n, on = struct.unpack_from("<4I", raw, 0)
    assert magic == 0x33335254, "нет признака TR33"
    off = 16
    names = {}
    for i in range(TRACE_TASKS):
        s = raw[off + i * TRACE_NAME: off + (i + 1) * TRACE_NAME].split(b"\0")[0].decode("ascii", "replace")
        if s:
            names[i] = s
    off += TRACE_TASKS * TRACE_NAME
    recs = [struct.unpack_from("<IBBH", raw, off + 8 * i) for i in range(n)]
    first = max(0, head - n)                              # кольцо: живы последние n записей
    ev = [recs[i % n] for i in range(first, head)]
    return names, ev, head, n


def analyse(names, ev):
    start = next(i for i, e in enumerate(ev) if e[1] == 1)   # до первого IN — записи до обнуления счётчика
    ev = ev[start:]
    t0 = ev[0][0]
    ts, last = [], t0
    base = 0
    for e in ev:                                           # счётчик 32 бита: разворачиваем переполнение
        if e[0] < last:
            base += 1 << 32
        last = e[0]
        ts.append(base + e[0] - t0)
    ticks = [t for t, e in zip(ts, ev) if e[1] == 3]
    per_ms = (ticks[-1] - ticks[0]) / (len(ticks) - 1) if len(ticks) > 1 else 1e6   # счёт на тик = на 1 мс
    tick0 = ticks[0] - per_ms if ticks else 0              # момент тика 0 — по первому тику
    ms = lambda t: (t - tick0) / per_ms
    runs, cur, since = [], None, None
    for t, e in zip(ts, ev):
        if e[1] == 1:
            if cur is not None:
                runs.append((cur, ms(since), ms(t), prio))
            cur, since, prio = e[2], t, e[3]
    end = ts[-1]
    if cur is not None:
        runs.append((cur, ms(since), ms(end), prio))
    return dict(ev=ev, ts=ts, ms=ms, runs=runs, per_ms=per_ms, end=ms(end))


def lanes(names, a, t_from, t_to, step=0.25):
    order = [k for k in sorted({r[0] for r in a["runs"]}, key=lambda k: -max(r[3] for r in a["runs"] if r[0] == k))
             if sum(r[2] - r[1] for r in a["runs"] if r[0] == k) > 0.01]
    out = []
    width = int((t_to - t_from) / step)
    for k in order:
        base = min(r[3] for r in a["runs"] if r[0] == k)
        own, inh = [0.0] * width, [0.0] * width             # сколько клетки задача проработала
        for task, b, e, prio in a["runs"]:
            if task != k:
                continue
            for c in range(max(0, int((b - t_from) / step)), min(width, int((e - t_from) / step) + 1)):
                o = min(e, t_from + (c + 1) * step) - max(b, t_from + c * step)
                if o > 0:
                    (own if prio == base else inh)[c] += o
        row = ["^" if inh[c] >= step / 2 else "#" if own[c] + inh[c] >= step / 2 else "." if own[c] + inh[c] > step / 20 else " "
               for c in range(width)]
        out.append("%-7s|%s|" % (names.get(k, "?%d" % k), "".join(row)))
    every = 1 if step <= 0.25 else 5                      # подписи шкалы: каждую 1 или 5 мс
    scale = [" "] * (width + 6)
    t = t_from
    while t <= t_to:
        lab = "%g" % t
        c = int(round((t - t_from) / step))
        scale[c:c + len(lab)] = lab
        t += every
    out.append("%-7s %s" % ("мс", "".join(scale).rstrip()))
    return out


def report(path, t_from=None, t_to=None, svg=None, step=0.25):
    names, ev, head, n = load(path)
    a = analyse(names, ev)
    ms = a["ms"]
    print("файл %s: записей %d, в кольце %d, счёт на 1 мс %.0f" % (os.path.basename(path), head, min(head, n), a["per_ms"]))
    # отрезки работы
    print("отрезки работы (задача: с … по, мс):")
    for task, b, e, prio in a["runs"]:
        if e - b >= 0.05 and names.get(task) != "IDLE":
            print("  %-7s %7.3f … %7.3f  (%.3f мс, приоритет %d)" % (names.get(task, "?"), b, e, e - b, prio))
    # события ресурса
    for t, e in zip(a["ts"], a["ev"]):
        if e[1] in (4, 5, 6, 7, 8) and e[3] == 1 or e[1] in (7, 8):
            print("  %8.3f мс %-10s %-7s арг %d" % (ms(t), EV[e[1]], names.get(e[2], "?"), e[3]))
    # ожидание ресурса: WAIT → следующий TAKE той же задачей
    waits = {}
    pend = {}
    for t, e in zip(a["ts"], a["ev"]):
        if e[1] == 6:
            pend[e[2]] = t
        elif e[1] == 5 and e[2] in pend:
            waits.setdefault(e[2], []).append((ms(pend[e[2]]), ms(t)))
            del pend[e[2]]
    for k, w in waits.items():
        for b, e in w:
            print("ожидание ресурса %s: %.3f … %.3f мс = %.3f мс" % (names.get(k), b, e, e - b))
            busy = {}
            for task, rb, re_, prio in a["runs"]:
                o = min(e, re_) - max(b, rb)
                if o > 0 and task != k:
                    busy[task] = busy.get(task, 0.0) + o
            print("  пока ждала, работали: " + ", ".join("%s %.3f мс" % (names.get(t), busy[t]) for t in sorted(busy, key=lambda t: -busy[t])))
    # готова → работает
    ready = {}
    lat = {}
    starts = {}
    for t, e in zip(a["ts"], a["ev"]):
        if e[1] == 2 and e[2] not in ready:
            ready[e[2]] = t
        elif e[1] == 1 and e[2] in ready:
            lat.setdefault(e[2], []).append((ms(ready[e[2]]), t - ready.pop(e[2])))
            starts.setdefault(e[2], []).append(ms(t))
    for k in sorted(lat):
        if names.get(k) in ("IDLE", "ctl"):
            continue
        v = [x[1] for x in lat[k] if x[0] >= 1.0]          # первый запуск при старте не считаем
        if v:
            worst = max(lat[k], key=lambda x: x[1])
            print("готова→работает %-7s раз %3d: от %d до %d отсчётов (%.3f мс), среднее %.3f мс; худшее — готова на %.0f мс"
                  % (names.get(k), len(v), min(v), max(v), max(v) / a["per_ms"], sum(v) / len(v) / a["per_ms"], worst[0]))
    # доли процессора
    tot = {}
    for task, b, e, prio in a["runs"]:
        tot[task] = tot.get(task, 0.0) + (e - b)
    span = sum(tot.values())
    print("доли процессора по трассе за %.3f мс:" % span)
    for k in sorted(tot, key=lambda k: -tot[k]):
        print("  %-7s %8.3f мс %5.1f %%" % (names.get(k), tot[k], 100.0 * tot[k] / span))
    cnt = {}
    for e in a["ev"]:
        cnt[EV[e[1]]] = cnt.get(EV[e[1]], 0) + 1
    print("события: " + ", ".join("%s %d" % (k, cnt[k]) for k in sorted(cnt, key=lambda k: -cnt[k])))
    print("записей на 1 мс: %.2f; в среднем между записями %.1f отсчёта"
          % (len(a["ev"]) / a["end"], (a["ts"][-1] - a["ts"][0]) / (len(a["ts"]) - 1)))
    if t_from is not None:
        print("диаграмма %g … %g мс, клетка %g мс (# — работает полклетки и больше, . — меньше, ^ — с унаследованным приоритетом):" % (t_from, t_to, step))
        for ln in lanes(names, a, t_from, t_to, step):
            print(ln)
    if svg:
        open(svg, "w", encoding="utf-8").write(to_svg(names, a, t_from or 0, t_to or a["end"]))
    return names, a


def to_svg(names, a, t_from, t_to):
    order = sorted({r[0] for r in a["runs"]}, key=lambda k: -max(r[3] for r in a["runs"] if r[0] == k))
    W, x0, row = 900, 80, 28
    X = lambda t: x0 + (t - t_from) * (W - x0 - 10) / (t_to - t_from)
    h = 30 + row * len(order) + 30
    p = ['<svg xmlns="http://www.w3.org/2000/svg" width="%d" height="%d" font-family="sans-serif" font-size="12">' % (W, h),
         '<rect width="100%" height="100%" fill="#fff"/>']
    for i, k in enumerate(order):
        y = 20 + i * row
        p.append('<text x="4" y="%d">%s</text>' % (y + 16, names.get(k, "?")))
        p.append('<line x1="%d" y1="%d" x2="%d" y2="%d" stroke="#ccc"/>' % (x0, y + 22, W - 10, y + 22))
        base = min(r[3] for r in a["runs"] if r[0] == k)
        for task, b, e, prio in a["runs"]:
            if task == k and e > t_from and b < t_to:
                p.append('<rect x="%.1f" y="%d" width="%.1f" height="18" fill="%s"/>'
                         % (X(max(b, t_from)), y + 4, max(0.5, X(min(e, t_to)) - X(max(b, t_from))), "#00629B" if prio == base else "#C62828"))
    for t in range(int(t_from), int(t_to) + 1):
        p.append('<text x="%.1f" y="%d" text-anchor="middle" fill="#666">%d</text>' % (X(t), h - 8, t))
    p.append("</svg>")
    return "".join(p)


if __name__ == "__main__":
    sys.stdout.reconfigure(encoding="utf-8")
    args = sys.argv[1:]
    svg = t_from = t_to = None
    step = 0.25
    if "--step" in args:
        i = args.index("--step")
        step = float(args[i + 1])
        del args[i:i + 2]
    if "--svg" in args:
        i = args.index("--svg")
        svg = args[i + 1]
        del args[i:i + 2]
    if "--from" in args:
        i = args.index("--from")
        t_from, t_to = float(args[i + 1]), float(args[i + 3])
        del args[i:i + 4]
    report(args[0], t_from, t_to, svg, step)
Next: section 34 "FreeRTOS macros" — a reference table of everything met in part IV, and self-check questions.