 Embedded HandbookApps
75а. A profiler on the chip itself: sampling the program counter by timer and through the DWT
Section 75.2 showed a profiler on the PC and left two techniques for the chip: a cycle counter around code regions (73.1, 35.3) and per-task time accounting by the RTOS kernel (26.9, 33б). Both share one condition: you must know in advance what to measure, so you place markers or split the work into tasks. When you do not know where to look, you need a third technique: a timer interrupt checks, again and again, which instruction the program was executing at that moment. Take a thousand such samples, and the share of samples in each function equals its share of time. There are no markers in the code at all.
There are two methods here. The first is your own timer interrupt handler: it works on any Cortex-M, and the whole code is 114 bytes without the output part. It has been built, run in QEMU and checked against the truth, a count of every executed instruction. The same test bench caught two traps that make the profile lie without showing it: sampling in step with the program, and regions with interrupts disabled. The second method lets the core itself take the samples: the DWT unit sends addresses into the ITM stream over the SWO line (section 21), and the program spends not a single instruction on it. For this method the section gives the register setup and its own stream parser, tested on synthetic data.
Background: the exception frame and EXC_RETURN — section 7а; SWO, ITM and
packets — section 21; the cycle counter — 35.3 and 73; task tracing — 33б.
Documents: core_cm3.h and core_cm4.h from CMSIS 5.9.0 (the DWT->CTRL
bits), RM0090 and RM0008 (the DWT and ITM units of the F4 and F1), RM0468
(the description of the DWT_CTRL fields). The DWT packet format is taken
from the pyOCD 0.45.1 parser (github.com/pyocd/pyOCD, file
pyocd/trace/swo.py, Apache-2.0 license). The experiments run in the stm-arm:1 image:
arm-none-eabi-gcc 12.2.1, QEMU 7.2.22, machines netduinoplus2 (Cortex-M4,
the same as in 33б) and netduino2 (Cortex-M3; its RCC, USART1 and TIM2
sit at the same addresses as on the F4).
What it is called in the documentation
Term Meaning sampling (statistical) profiler a profiler that checks once per period where the program is PC sample one sample of the program counter histogram bucket one counter for a range of addresses lockstep sampling sampling in step with the program: the period is a multiple of its loop randomized sampling period a sampling period with a random addition skid the sample is attributed to an instruction other than the one that was running periodic PC sample packet a periodic PC sample packet from the DWT unit hardware source packet a packet from the core hardware, not from the program POSTCNT, POSTPRESET the DWT divider counter for the sampling period and the value it counts from
75а.1 The idea: samples instead of markers
A cycle counter answers the question "how long does this region take". Sampling answers another one: "where does the time of the whole program go". A timer interrupts the program at equal intervals; the handler records the address of the instruction where it caught the program. A function that takes 70 % of the time shows up in 70 % of the samples, like passers-by in photos of a street taken once a minute.
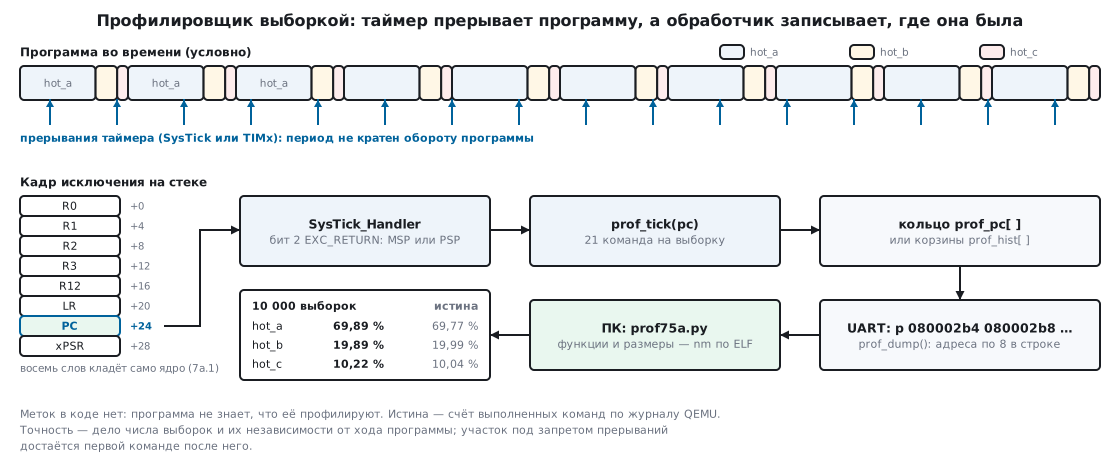
What it gives and what it does not:
- it gives the share of time of every function, including library ones and the ones nobody thought about; with raw addresses, down to a source line;
- it does not give call counts, the "who called whom" chain or the exact duration of one pass; for that you still have the cycle counter and tracing;
- the accuracy is statistical: it grows with the number of samples, and only if the samples are not tied to the program flow (75а.4).
75а.2 The handler: PC from the exception frame
On interrupt entry the core itself pushes eight words onto the stack (7а.1).
The word with index 6, at offset 24 bytes, is PC: the address of the
instruction that would have executed next. That is the word to take. There is
one subtlety: the frame lies on the stack the interrupted code was using,
MSP or PSP; which of the two is told by bit 2 of the EXC_RETURN value in
LR (7а.3). A prologue of six instructions finds the frame and passes PC to
an ordinary C function:
__attribute__((naked)) void PROF_ISR(void)
{
    __asm volatile(
        "tst   lr, #4        \n"         /* бит 2 EXC_RETURN: на каком стеке лежит кадр */
        "ite   eq            \n"
        "mrseq r0, msp       \n"
        "mrsne r0, psp       \n"
        "ldr   r0, [r0, #24] \n"         /* слово 6 кадра — PC прерванной программы */
        "b     prof_tick     \n");
}
PROF_ISR is the name of the handler of the timer that drives the sampling.
There are two to choose from, and the difference between them is hidden in
three macros:
#if PROF_TIM3                            /* выборку ведёт TIM3 */
#define PROF_ISR          TIM3_IRQHandler
#define PROF_ACK()        (TIM_SR(TIM3_BASE) = ~1u)          /* снять флаг обновления UIF */
#define PROF_PERIOD(t)    (TIM_ARR(TIM3_BASE) = (t) - 1u)
#else                                    /* выборку ведёт SysTick: флаг снимать не нужно */
#define PROF_ISR          SysTick_Handler
#define PROF_ACK()        ((void)0)
#define PROF_PERIOD(t)    (SYST_RVR = (t) - 1u)
#endif
The sample itself is writing the address into a ring or adding one to a bucket:
__attribute__((used)) void prof_tick(uint32_t pc)
{
    PROF_ACK();                          /* первым делом, иначе прерывание TIM3 повторится */
#if PROF_HIST
    uint32_t i = (pc - (uint32_t)&_stext) >> PROF_SHIFT;
    if (i >= PROF_BINS)
        prof_out++;                      /* адрес вне корзин: ОЗУ, загрузчик, чужой код */
    else if (prof_hist[i] != 0xFFFFu)
        prof_hist[i]++;                  /* насыщение: счётчик не обернётся в ноль */
#else
    prof_pc[prof_n & (PROF_RAW_N - 1u)] = pc;   /* кольцо: новая выборка затирает самую старую */
#ifdef PROF_TAG
    prof_tag[prof_n & (PROF_RAW_N - 1u)] = (uint32_t)PROF_TAG;
#endif
#endif
#if PROF_JITTER
    prof_rnd ^= prof_rnd << 13;          /* xorshift32: следующий период — случайной длины */
    prof_rnd ^= prof_rnd >> 17;
    prof_rnd ^= prof_rnd << 5;
    PROF_PERIOD(prof_period + (prof_rnd & PROF_JITTER));
#endif
    if (++prof_n == prof_limit)
        prof_stop();                     /* набрали заказанное — таймер стоп */
}
prof_tick returns with an ordinary bx lr: LR still holds EXC_RETURN,
and the core unstacks the frame itself. What the PROF_JITTER and PROF_TAG
lines are for is explained in 75а.4
and 75а.5. Starting:
void prof_start(uint32_t period, uint32_t limit)
{
    prof_n = 0u;
    prof_limit = limit;                  /* 0 — без остановки: в кольце последние PROF_RAW_N выборок */
#if PROF_JITTER
    prof_period = period;
#endif
#if PROF_TIM3
    RCC_APB1ENR |= RCC_TIM3EN;
    TIM_CR1(TIM3_BASE) = 0u;
    TIM_PSC(TIM3_BASE) = PROF_TIM3_PSC;  /* TIM3 16-битный: период длиннее 65 536 отсчётов — через делитель */
    PROF_PERIOD(period);
    TIM_EGR(TIM3_BASE) = 1u;             /* UG: делитель и период действуют сразу */
    TIM_SR(TIM3_BASE) = 0u;              /* флаг от UG не нужен */
    TIM_DIER(TIM3_BASE) = 1u;            /* UIE: прерывание по обновлению */
    NVIC_IPR(TIM3_IRQ) = 0u;             /* приоритет 0 — срочнее всех */
    NVIC_ISER0 = 1u << TIM3_IRQ;
    TIM_CR1(TIM3_BASE) = 1u;             /* CEN */
#else
    SCB_SHPR_SYSTICK = 0u;               /* приоритет 0 — срочнее всех */
    PROF_PERIOD(period);                 /* период — в тактах ядра, до 2^24 */
    SYST_CVR = 0u;
    SYST_CSR = 7u;                       /* ENABLE | TICKINT | CLKSOURCE: счёт от частоты ядра */
#endif
}
Which timer. Every STM32 has SysTick, but in real firmware it is usually
taken: the HAL tick or the RTOS kernel tick. Then the sampling goes to a free
timer: build with PROF_TIM3=1, the handler is the same. The experiments below
run on SysTick; the TIM3 variant is built for the F103 and F407 but was not
run: in QEMU 7.2 the TIM3 update event does not arrive with period ARR; with
ARR = 9999 more than 100000 counts passed between interrupts.
Cortex-M0. It has no tst with an immediate and no ite; the file has a
second prologue of ten instructions, selected automatically by
__ARM_ARCH_6M__ and built for -mcpu=cortex-m0.
After an -Os build the handler is 6 prologue instructions and 15
instructions of prof_tick: 21 instructions per sample. The collected
data is output by prof_dump(), addresses in hex, eight per line:
prof raw n=10000
p 080002b4 080002b8 080002ac 080002b2 080002ce 080002aa 080002b0 080002b0
p 080002b4 080002b8 080002ac 080002b2 080002ce 080002aa 080002ba 080002b0
75а.3 Analysis on the PC and the first profile
The ELF symbol table turns addresses into names. The command
arm-none-eabi-nm -n -S prints the address and size of every function; what
remains is to find whose range each address falls into and count. The
prof75a.py script has five functions (the import lines and the
command-line entry point are omitted):
def load_symbols(elf, nm="arm-none-eabi-nm"):
    """Функции из ELF: список (адрес, размер, имя) по возрастанию адреса."""
    out = subprocess.run([nm, "-n", "-S", "--defined-only", elf],
                         capture_output=True, text=True, check=True).stdout
    syms, seen = [], set()
    for line in out.splitlines():
        f = line.split()
        if len(f) == 4 and f[2] in "TtW" and int(f[0], 16) not in seen:
            seen.add(int(f[0], 16))             # слабые синонимы по тому же адресу — один раз
            syms.append((int(f[0], 16), int(f[1], 16), f[3]))
    return syms


def lookup(syms, pc):
    """Имя функции, в которую попадает адрес, или «?»."""
    i = bisect.bisect_right(syms, (pc, 1 << 32)) - 1
    if i >= 0 and pc < syms[i][0] + syms[i][1]:
        return syms[i][2]
    return "?"


def read_dump(path):
    """Вернуть (сырые адреса, корзины): корзины — список (начало, размер, счётчик)."""
    raw, bins, base, shift, k = [], [], 0, 0, 0
    for line in open(path, encoding="ascii", errors="replace"):
        m = re.match(r"prof hist base=0x([0-9a-f]+) shift=(\d+)", line)
        if m:
            base, shift, k = int(m.group(1), 16), int(m.group(2)), 0
        elif line.startswith("p "):
            raw += [int(x, 16) for x in line.split()[1:]]
        elif line.startswith("h "):
            for x in line.split()[1:]:
                if int(x, 16):
                    bins.append((base + (k << shift), 1 << shift, int(x, 16)))
                k += 1
    return raw, bins


def by_function(syms, raw, bins):
    """Счёт выборок по функциям. Корзина на стыке функций делится между ними по числу байт."""
    cnt = collections.Counter()
    for pc in raw:
        cnt[lookup(syms, pc)] += 1
    for start, size, n in bins:
        owners = [lookup(syms, a) for a in range(start, start + size, 2)]   # команды Thumb — по чётным адресам
        owners = [o for o in owners if o != "?"] or ["?"]                   # заполнитель между функциями не в счёт
        for o in owners:
            cnt[o] += n / len(owners)
    return cnt


def report(cnt):
    total = sum(cnt.values())
    print("samples %d" % round(total))
    for name, n in sorted(cnt.items(), key=lambda kv: (-kv[1], kv[0])):
        print("  %6.2f %%  %8.1f  %s" % (100.0 * n / total, n, name))
A reference program. To check a profiler you need a program whose answer is known in advance. Three identical loops; the share of time is set by the number of iterations:
__attribute__((noinline)) void hot_a(uint32_t n)
{
    for (uint32_t i = 0; i < n; i++)
        __asm volatile("nop");
}
        while (prof_n < limit) {
            hot_a(700);
            hot_b(200);
            hot_c(100);
        }
The truth. QEMU runs with -icount shift=0: model time advances by
instructions, one instruction is one nanosecond, and a run repeats
instruction for instruction. With -singlestep -d exec the emulator logs
every executed instruction with the function name. According to the log, one
loop iteration is exactly 5022 instructions: hot_a 3504 (69.77 %), hot_b
1004 (19.99 %), hot_c 504 (10.04 %), and the loop itself in run 10
(0.20 %). These are the true shares: in QEMU all instructions cost the same.
The profile. SysTick->LOAD holds 2012: at the 168 MHz core clock of this
QEMU machine that gives one sample per 11982 instructions. The prof75a.py
table for 10000 samples:
samples 10000
   69.89 %    6989.0  hot_a
   19.89 %    1989.0  hot_b
   10.22 %    1022.0  hot_c
The same for the first 100 and 1000 samples, next to the truth (the last column is the largest deviation, in percentage points):
N            hot_a     hot_b     hot_c       run   max error
truth        69.77     19.99     10.04      0.20
100          70.00     20.00     10.00      0.00   0.23
1000         69.80     19.90     10.30      0.00   0.26
10000        69.89     19.89     10.22      0.00   0.20
The profile is correct to a quarter of a percent after just a hundred
samples. But two things should make you suspicious. The error does not
drop: ten thousand samples are no more accurate than a hundred. And run
got not a single sample out of ten thousand, although it should get
twenty. Both oddities are the same trap.
75а.4 Two traps: sampling in step with the program, and disabled interrupts
Sampling in step with the program
Between two samples the program executes 11982 − 21 = 11961 instructions: the
handler itself eats 21. A loop iteration is 5022 instructions, so per sample
the point inside the iteration moves by 11961 − 2 × 5022 = 1917 instructions.
The numbers 1917 and 5022 have a common divisor of 27. So the sampling visits
only 5022 / 27 = 186 points of the iteration and then goes round them in a
circle. Analysis of the dump confirmed it: the address sequence repeats every
186 samples, and there are 15 distinct addresses among the ten thousand. The
instructions of run did not fall on those 186 points, and they never will.
After the 186th sample the profile gets no new information.
It is worse when the period is "well" chosen:
LOAD + 1 |
Period, instructions | Result |
|---|---|---|
| 1691 | 10065 = 2 × 5022 + 21 | all 1000 samples are one address 0x080002b0: hot_a 100 % |
| 1681 | 10005 | shift of 60 instructions per sample; first 100 samples: 58 / 25 / 16 / 1 %, error 11.77 |
| 2013 | 11982 | 186 points of the iteration; error 0.2 and does not drop |
A free-running loop falls into step by chance. But some programs are in step always: a main loop driven by a timer.
__attribute__((noinline)) void wait_tick(void)
{
    while ((int32_t)(now() - next_at) < 0) {
    }
    next_at += TICK;
}
    while (prof_n < limit) {
        wait_tick();
        control();
        filter();
    }
Once every 9999 instructions it runs control and the filter; the rest of the
time it waits. The truth from the log: wait_tick 59.82 %, control
30.08 %, filter 10.03 %. Sampling with the same period of 9999
instructions, the natural wish to "measure once per tick", gave three runs and
three different answers, depending on when the main loop started relative to
the sampling:
| Start offset, instructions | Profile over 1000 samples |
|---|---|
| 1000 | wait_tick 100 % |
| 8000 | control 100 % |
| 6500 | filter 100 % |
Each answer looks convincing and each is false. A period six instructions longer (10005) is also bad: over 1000 samples the point crept 6000 instructions out of 9999, giving 33.20 / 50.10 / 16.70 % against the truth of 59.82 / 30.08 / 10.03. A period of 10577, far from a multiple, gave 60.00 / 30.20 / 9.80 %, an error of 0.23.
The cure is a random addition to the period. Build with PROF_JITTER=2047:
after each sample the handler adds a random number from 0 to 2047 timer ticks
to the period (the xorshift32 lines in prof_tick). The base period is
deliberately the worst one, 1691, the very one that gave a single address.
With the random addition, 100000 samples of the reference program gave
69.98 / 19.91 / 9.93 / 0.18 %, and run got its 0.18 % against the true
0.20. The sequence no longer repeats.
The price is honest statistics. The samples are now independent, and the
error follows the √N law: for a function with share p the standard
deviation is √(p(1 − p) / N). The same 100000 samples split into blocks of N;
each cell shows the measured spread and the theory, in percentage points:
| N per block | Blocks | hot_a |
hot_b |
hot_c |
|---|---|---|---|---|
| 100 | 1000 | 4.59 / 4.59 | 4.07 / 4.00 | 2.90 / 3.00 |
| 1000 | 100 | 1.54 / 1.45 | 1.25 / 1.26 | 0.97 / 0.95 |
| 10000 | 10 | 0.47 / 0.46 | 0.37 / 0.40 | 0.36 / 0.30 |
The measurement matched the theory. Hence the rule: ten times more accurate means a hundred times more samples. A thousand samples tell functions apart to about one percent, which is enough to find a bottleneck. The program with the timer-driven main loop, with the same addition, gave 58.80 / 32.40 / 8.70 % over 1000 samples, an error of 2.32 with a theoretical spread of 1.45.
Disabled interrupts
The second trap is code that an interrupt cannot enter.
__attribute__((noinline)) void irq_off(void)
{
    __asm volatile("cpsid i");
}

__attribute__((noinline)) void irq_on(void)
{
    __asm volatile("cpsie i");
}

__attribute__((noinline)) void locked(uint32_t n)
{
    irq_off();
    for (uint32_t i = 0; i < n; i++)
        __asm volatile("nop");
    irq_on();
}
The program calls locked(300) and hot_a(700) in turn. According to the
log, locked takes 30.00 % of the time and irq_on 0.04 %: it has two
instructions. The profile over 10000 samples (with the period addition):
samples 10000
   69.89 %    6989.0  hot_a
   29.92 %    2992.0  irq_on
    0.15 %      15.0  main
    0.03 %       3.0  locked
    0.01 %       1.0  irq_off
All the time of locked went to irq_on. The timer fired inside the closed
region, the interrupt waited, and it entered right after cpsie i. All 2992
samples lie at one address, 0x080002fc: this is bx lr, the instruction
following cpsie i; addr2line names line 169, the closing brace of
irq_on. The share is right, the place is not: the time is attributed to the
first instruction after the region.
If the region is longer than the sampling period, the share is lost as well.
An interrupt can only be pending once: however many times the timer fires
while interrupts are disabled, there will be one sample. locked(7500) is
37507 instructions, about two periods. The truth is the same, 30.00 %; the
profile showed 17.10 % for irq_on and 82.89 % for hot_a. The same 10000
samples took 213734338 instructions against 180510156 in the previous run:
15.5 % of the timer events were lost.
Another handler acts like disabled interrupts. An interrupt does not
preempt a handler with the same or a more urgent priority. In the experiment
the EXTI0 handler runs isr_work, 29.97 % of the time according to the log.
With a priority equal to the sampling, isr_work got not a single sample out
of 10000, and 30.35 % landed on main: of that, 30.26 on one instruction at
address 0x08000366, the one after the instruction that raised the
interrupt. Once EXTI0 was made less urgent (priority 0x80), isr_work got
its 30.22 %. That is why prof_start gives the sampling priority 0.
75а.5 Cost, buckets and RTOS tasks
Instructions per sample. The same work was run without the profiler and with it; the difference in the instruction count divided by the number of samples is an integer, the same on Cortex-M3 and Cortex-M4:
| Build | Instructions per sample |
|---|---|
| ring of raw addresses | 21 |
| buckets | 30 |
| ring + random addition | 32 |
| buckets + random addition | 41 |
Cycles were not measured on a board. An upper estimate by the rule from 9.7, 12 cycles for entry and for exit and two cycles per instruction: 12 + 12 + 2 × 21 = 66 cycles.
| 1000 samples per second | 10000 per second | |
|---|---|---|
| F103, 72 MHz | 0.09 % | 0.92 % |
| F407, 168 MHz | 0.04 % | 0.39 % |
A thousand samples per second is almost free. The most expensive build, 41 instructions, is 106 cycles and 1.47 % at 72 MHz with 10000 samples per second.
Memory (-Os, Cortex-M3, F103 addresses). The prologue, prof_tick,
prof_start and prof_stop take 20 + 44 + 40 + 10 = 114 bytes; prof_dump
another 118; the whole object file is 256 bytes of code and strings. RAM is
4104 bytes: a ring of 1024 samples of 4 bytes each and two counters. The
bucket build is 348 bytes of code and 524 bytes of RAM: 256 buckets of
2 bytes cover 4 KB of code.
Ring or buckets. The ring keeps the address of every sample: the accuracy is down to an instruction, but 10000 samples are 40 KB, twice the whole RAM of the F103C8. Buckets are a counter per address range: memory does not depend on the number of samples, and you can accumulate for hours. The price is accuracy. The same 100000 samples spread over buckets of different sizes (the program code is 760 bytes):
| Bucket, bytes | Buckets | RAM, bytes | hot_a |
hot_b |
hot_c |
run |
Error |
|---|---|---|---|---|---|---|---|
| raw addresses | — | 400000 | 69.98 | 19.91 | 9.93 | 0.18 | 0 |
| 2 | 380 | 760 | 69.98 | 19.91 | 9.93 | 0.18 | 0 |
| 4 | 190 | 380 | 63.02 | 26.87 | 8.94 | 1.16 | 6.96 |
| 16 | 48 | 96 | 43.45 | 31.98 | 10.22 | 3.86 | 26.53 |
A 2-byte bucket is exact, since Thumb instructions sit at even addresses, but
it needs as much RAM as there is code. Any larger, and a bucket covers the
boundary between functions: hot_a takes 14 bytes, and its hot instructions
share a bucket with a neighbour. Firmware with 16-byte buckets showed hot_a
at 46.06 %, and gave 13.95 % to prof_dump, which was not running at that
time at all: it just lies right before hot_a.
The cure is to place functions on bucket boundaries. The
-ffunction-sections option and the SUBALIGN(16) keyword on the .text
section in the linker script align every function to 16 bytes. The code grew
from 1064 to 1208 bytes, but the same 16-byte buckets gave
69.20 / 20.23 / 10.34 / 0.23 %. In real firmware, functions are larger than
fourteen bytes, and only a small part of the samples lies on the boundaries;
still, check it on your own program with one run using the ring.
Under an RTOS. Tasks run on PSP, and the frame of the interrupted task
lies on its stack (7а.3). The prologue from 75а.2 already handles that: the
reference program moved to PSP gave the same 686, 193 and 121 samples out of
1000 as on MSP. What remains is the question "whose time is this": the same
function is called by different tasks. The answer is to store, next to the
address, a pointer to the current task's control block. Building with
-DPROF_TAG=pxCurrentTCB adds one store to prof_tick (the PROF_TAG lines
in 75а.2) and 4 bytes per sample. The experiment uses FreeRTOS 10.5.1
(github.com/FreeRTOS/FreeRTOS-Kernel, MIT license), the ARM_CM3 port; two tasks
call the same hot_a:
static void task_motor(void *arg)
{
    (void)arg;
    prof_start(PERIOD, cfg_samples);     /* после старта планировщика: он опускает приоритет SysTick */
    for (;;) {
        hot_a(600);
        if (prof_n >= cfg_samples)
            finish();
        taskYIELD();
    }
}

static void task_link(void *arg)
{
    (void)arg;
    for (;;) {
        hot_a(300);
        hot_b(100);
        taskYIELD();
    }
}
Before the dump the firmware prints a "block address — name" table
(pcTaskGetName), and the analysis splits 5000 samples by task:
samples 5000, tags 5000
   60.46 %    3023  task motor
   39.54 %    1977  task link
   59.06 %    2953  motor / hot_a
   29.02 %    1451  link / hot_a
    9.14 %     457  link / hot_b
By function, hot_a gets 88.08 % (87.72 % according to the log), and these
percent split between the tasks two to one, as 600 iterations to 300. Task
switching (vTaskSwitchContext and PendSV_Handler) took 2.36 % of the
samples against 2.02 % in the log. Three caveats. The sampling runs at
priority 0, more urgent than the configMAX_SYSCALL_INTERRUPT_PRIORITY
threshold, so it also sees the kernel's critical sections, but you must not
call kernel functions from it (28.6); reading one pointer is fine. In the
experiment SysTick is given to the profiler, the kernel tick is off, and the
tasks yield to each other themselves; on a board the tick stays with the
kernel, and the sampling gets a TIMx. And the kernel's task time accounting
(33б.6, 35.3) gives the same per-task shares more cheaply; sampling is needed
when the question is "which function inside the task".
75а.6 Sampling by the core itself: DWT and ITM
On the Cortex-M3 and M4 the hardware can take the samples. RM0090 and RM0008 list "PC sampler" among the roles of the DWT unit, and among the ITM packets they list software ones, from a write to a stimulus port (section 21), and hardware ones: those are generated by the DWT, and the ITM only sends them. There is no handler, and the program spends not a single instruction. The price is different: you need the SWO pin and a debug probe that receives it (21.1).
The control bits are in DWT->CTRL. The bit positions are taken from
core_cm3.h and core_cm4.h (they match), the meaning of the fields from
RM0468, where this register is described for the Cortex-M7 of the same
architecture; RM0090 and RM0008 do not describe the fields:
| Field | Bits | What it does |
|---|---|---|
CYCCNTENA |
0 | enables the cycle counter CYCCNT (35.3) |
POSTPRESET |
4:1 | the value from which the POSTCNT divider counter counts down |
POSTINIT |
8:5 | its initial value; writable only while POSTCNT is disabled |
CYCTAP |
9 | which CYCCNT bit clocks POSTCNT: 0 — bit 6, 1 — bit 10 |
PCSAMPLENA |
12 | POSTCNT acts as the timer for periodic PC sample packets |
CYCEVTENA |
22 | the second consumer of POSTCNT: event counter packets |
One more bit is in ITM->TCR: DWTENA, bit 3, lets DWT packets into the
stream. The complete setup; the SWO line, the ITM key and the baud rate
divider are prepared by swo_init() from 21.2:
/* Включить периодическую выборку PC: tap — PCS_TAP_64 или PCS_TAP_1024, reload — 0…15. */
void pcs_start(uint32_t tap, uint32_t reload)
{
    swo_init();
    ITM->TCR |= ITM_TCR_DWTENA_Msk;      /* пропускать пакеты DWT в поток ITM */

    /* POSTINIT пишется, только пока POSTCNT выключен: сначала снять оба разрешения */
    DWT->CTRL &= ~(DWT_CTRL_PCSAMPLENA_Msk | DWT_CTRL_CYCEVTENA_Msk);
    DWT->CYCCNT = 0u;
    DWT->CTRL = (DWT->CTRL & ~(DWT_CTRL_CYCTAP_Msk | DWT_CTRL_POSTPRESET_Msk | DWT_CTRL_POSTINIT_Msk))
              | (tap << DWT_CTRL_CYCTAP_Pos)
              | (reload << DWT_CTRL_POSTPRESET_Pos)      /* с какого числа POSTCNT считает вниз */
              | (reload << DWT_CTRL_POSTINIT_Pos)        /* и с какого начинает */
              | DWT_CTRL_CYCCNTENA_Msk;                  /* POSTCNT шагает по биту CYCCNT: счётчик тактов должен идти */
    DWT->CTRL |= DWT_CTRL_PCSAMPLENA_Msk;                /* выборка пошла */
}
Period. Bit 6 of a binary counter toggles once every 64 cycles, bit 10 once every 1024: that is the POSTCNT step. The counter is four bits wide; if we assume it makes 16 steps from 15 to the reload, the slowest sampling is once per 1024 × 16 = 16384 cycles: 4394 samples per second at 72 MHz and 10254 at 168 MHz. The period was not measured on a board.
Packet. The format follows the pyOCD parser. The source packet header is
laid out as in 21.6: bits 1:0 are the data size (1, 2 or 4 bytes), bits 7:3
are the source number. Bit 2 is added: zero means the program writes, one
means the hardware. For hardware, number 0 is the event counters, 1 is
exception tracing, 2 is periodic PC sampling. Hence the sample header 0x17
and four address bytes, least significant first; address 0x080002b4 on the
line is 17 b4 02 00 08. pyOCD treats a zero address as a sample during
sleep: there is no PC. In the synthetic stream below such a packet is short:
15 00. Five bytes per sample at 200000 bytes per second on a 2 MHz line
(21.7) give a ceiling of 40000 samples per second for the whole stream.
The itm75a.py parser is one function:
def parse(data, wait_sync=False):
    """Вернуть список событий (тип, значение, …). Типы: pc, sleep, itm, cnt, exc, dwt, sync, ovf, ts, bad."""
    i, out = 0, []
    if wait_sync:                               # подключились посреди потока: ждать синхропакет
        i = data.find(SYNC)
        i = len(data) if i < 0 else i
    while i < len(data):
        h = data[i]
        i += 1
        if h == 0x00:                           # синхропакет: нули и завершающий 0x80
            j = i
            while j < len(data) and data[j] == 0x00:
                j += 1
            if j < len(data) and data[j] == 0x80 and j - i >= 4:
                out.append(("sync",))
            else:
                out.append(("bad", h))
            i = j + 1
        elif h == 0x70:                         # переполнение: часть пакетов потеряна
            out.append(("ovf",))
        elif h & 0x03 == 0:                     # служебный пакет: метка времени или расширение
            while h & 0x80 and i < len(data):   # бит 7 — «дальше ещё байт»
                h = data[i]
                i += 1
            out.append(("ts",))
        else:                                   # пакет источника: 1, 2 или 4 байта данных
            size = 1 << ((h & 0x03) - 1)
            if i + size > len(data):
                break                           # хвост потока оборван посреди пакета
            value = int.from_bytes(data[i:i + size], "little")
            i += size
            src = h >> 3
            if h & 0x04 == 0:
                out.append(("itm", src, value, size))       # запись программы в канал src
            elif src == 2:                                  # периодическая выборка PC
                out.append(("pc", value) if size == 4 else ("sleep", value))
            elif src == 0:
                out.append(("cnt", value))                  # переполнение счётчика событий DWT
            elif src == 1:
                out.append(("exc", value))                  # вход в исключение и выход
            else:
                out.append(("dwt", src, value))             # трассировка данных
    return out
Check. QEMU does not model the DWT and ITM units: after a write, DEMCR,
ITM->TCR and DWT->CTRL read back as zeros, and CYCCNT stands still. So
the stream is synthetic: 10000 addresses from the 75а.3 experiment are packed
into sample packets, mixed with everything that can appear on the line:
writes to stimulus ports 0 and 1, timestamps, exception tracing, event
counters, sleep packets, overflows and synchronization packets:
packet for pc 0x080002b4: 17 b4 02 00 08
stream 54887 bytes from 10000 samples: pc=10000 sleep=156 itm=1629 cnt=20 exc=100 dwt=0 sync=11 ovf=10 ts=101 bad=0
decoded = source: yes
All addresses came back, in the same order; the prof75a.py table from the
parsed stream matched the table from the UART dump. The same stream was
parsed by the pyOCD parser, and the events matched. A stream cut in the
middle of a packet started with a false write to port 0; when the parser waits
for the synchronization packet 00 00 00 00 00 80 (the --sync option),
parsing starts from a whole packet.
How it differs from method A. A DWT sample is not an interrupt, so disabled interrupts and other handlers should not disturb it: the second trap from 75а.4 does not apply. The first one remains: the period is chosen from a few steps, and there is no random addition. In Keil the same thing is enabled in the trace settings (PC Sampling), and the records appear in the Trace Records window as "PC Sample". There are also ready-made open-source receivers for this stream, for example Orbuculum (github.com/orbcode/orbuculum); it was not run here. Method B was not tested on hardware in this section.
75а.7 Pitfalls
The profile does not improve no matter how much you collect; a short function got not a single sample. The program is periodic and the sampling period is constant, so the sampling goes round a few points in a circle. In the experiment there were 186 of them out of 5022. The cure is a random addition to the period.
One function gets 100 %. The sampling period is a multiple of the program period: a timer-driven main loop and sampling "once per tick". Three runs gave 100 % to three different functions. Use a period that is not a multiple and not close to one, or better, one with a random addition.
The profile shows a "hot" function of two instructions. This is the end of
a region with interrupts disabled: the time of the closed region went to the
instruction after cpsie i. In the experiment, 29.92 % for irq_on. Look at
what came before this address.
A long closed region got less than it should. Only one interrupt is remembered while interrupts are disabled. A region of two sampling periods showed 17.10 % instead of 30.00 %.
An interrupt handler is invisible, and the code after it is "hot". The
sampling priority is not more urgent than the handler's. In the experiment
30.35 % went to main; with a higher sampling priority, the handler got
30.22 %.
All addresses are zeros or garbage. The frame was taken from the wrong
stack. The main code runs on PSP, but the prologue reads MSP: in the
experiment all 1000 samples gave the address 0x00000000. Pick the stack by
bit 2 of EXC_RETURN.
A function has disappeared from the profile. The compiler inlined it. The
same program at -O2: 100 % for main, no hot_a at all. Raw addresses fix
this: arm-none-eabi-addr2line -f -i unwinds inlined calls:
hot_a at app75a.c:27
 (inlined by) run at app75a.c:79
 (inlined by) main at app75a.c:97
Buckets showed a function that was not running. A bucket covered a
boundary between functions: 13.95 % for prof_dump with 16-byte buckets and
14-byte functions. Use smaller buckets, or functions aligned to the bucket
boundary.
Wrong names. Only the ELF of that very build maps addresses to names (35в.7): after any rebuild, functions move.
The SWO stream starts with garbage. The receiver started in the middle of a packet. Wait for a synchronization packet.
In QEMU the TIM3 profile does not add up. The timer model in QEMU 7.2
does not repeat the update with period ARR; for experiments in the emulator
use SysTick.
75а.8 Summary
- Sampling
PCfrom a timer interrupt shows where the time of the whole program goes, with no markers in the code.PCis word 6 of the exception frame; the frame's stack is chosen by bit 2 ofEXC_RETURN. - The handler costs 21 instructions per sample (30 with buckets, 32 and 41 with the random addition); 114 bytes of code without the output part. By estimate this is 66 cycles: 0.09 % of the CPU at 1000 samples per second at 72 MHz.
- On the reference program with a truth of 69.77 / 19.99 / 10.04 %, the
profile gave 69.89 / 19.89 / 10.22 % over 10000 samples. Analysis is done
by
prof75a.pyusing the symbol table fromarm-none-eabi-nm. - A constant period and a periodic program are a trap: 186 points out of 5022, and with a multiple period, a single address and 100 % for one function. A random addition to the period restores the √N law: for a function with a 70 % share the spread is 4.59 % over 100 samples, 1.54 % over 1000, 0.47 % over 10000.
- Disabled interrupts shift the sample to the instruction after the region
(29.92 % for the two-instruction
irq_on), and a long region also loses samples (17.10 % instead of 30.00 %). Another handler is visible only if the sampling is more urgent than it. - A ring of addresses is exact but costs 4 bytes per sample. Buckets do not depend on the number of samples but lie at function boundaries: error 6.96 with a 4-byte bucket and 26.53 with 16; aligning functions to 16 bytes removes it at the cost of 144 bytes of code.
- Under an RTOS,
pxCurrentTCBis stored next to the address: 60.46 % for one task and 39.54 % for the other with a shared function. - The Cortex-M3 and M4 can sample by themselves:
PCSAMPLENAinDWT->CTRL, packet0x17and four address bytes in the ITM stream. The parser was tested on a synthetic stream of 54887 bytes and checked against pyOCD; it was not run on hardware.
Full source code
prof75a.c — the sampling profiler.
/* Раздел 75а: профилировщик выборкой. Прерывание таймера берёт из кадра исключения PC
 * прерванной программы и кладёт его в кольцо (PROF_HIST = 0) или в гистограмму (PROF_HIST = 1). */
#include "prof75a.h"
#include "io75a.h"

#if PROF_TIM3                            /* выборку ведёт TIM3 */
#define PROF_ISR          TIM3_IRQHandler
#define PROF_ACK()        (TIM_SR(TIM3_BASE) = ~1u)          /* снять флаг обновления UIF */
#define PROF_PERIOD(t)    (TIM_ARR(TIM3_BASE) = (t) - 1u)
#else                                    /* выборку ведёт SysTick: флаг снимать не нужно */
#define PROF_ISR          SysTick_Handler
#define PROF_ACK()        ((void)0)
#define PROF_PERIOD(t)    (SYST_RVR = (t) - 1u)
#endif

extern uint32_t _stext;                  /* начало кода — из скрипта компоновщика */

volatile uint32_t prof_n;
static uint32_t prof_limit;
#if PROF_HIST
uint16_t prof_hist[PROF_BINS];
uint32_t prof_out;
#else
uint32_t prof_pc[PROF_RAW_N];
#ifdef PROF_TAG                          /* метка к каждой выборке, например текущая задача ОСРВ */
extern void *volatile PROF_TAG;
uint32_t prof_tag[PROF_RAW_N];
#endif
#endif
#if PROF_JITTER
static uint32_t prof_period;
static uint32_t prof_rnd = 2463534242u;
#endif

#if defined(__ARM_ARCH_6M__)             /* Cortex-M0/M0+: команд tst с константой и ite там нет */
__attribute__((naked)) void PROF_ISR(void)
{
    __asm volatile(
        "movs  r0, #4        \n"
        "mov   r1, lr        \n"
        "tst   r1, r0        \n"         /* бит 2 EXC_RETURN: на каком стеке лежит кадр */
        "bne   1f            \n"
        "mrs   r0, msp       \n"
        "b     2f            \n"
        "1: mrs r0, psp      \n"
        "2: ldr r0, [r0, #24]\n"         /* слово 6 кадра — PC прерванной программы */
        "ldr   r1, =prof_tick\n"
        "bx    r1            \n");
}
#else
__attribute__((naked)) void PROF_ISR(void)
{
    __asm volatile(
        "tst   lr, #4        \n"         /* бит 2 EXC_RETURN: на каком стеке лежит кадр */
        "ite   eq            \n"
        "mrseq r0, msp       \n"
        "mrsne r0, psp       \n"
        "ldr   r0, [r0, #24] \n"         /* слово 6 кадра — PC прерванной программы */
        "b     prof_tick     \n");
}
#endif

__attribute__((used)) void prof_tick(uint32_t pc)
{
    PROF_ACK();                          /* первым делом, иначе прерывание TIM3 повторится */
#if PROF_HIST
    uint32_t i = (pc - (uint32_t)&_stext) >> PROF_SHIFT;
    if (i >= PROF_BINS)
        prof_out++;                      /* адрес вне корзин: ОЗУ, загрузчик, чужой код */
    else if (prof_hist[i] != 0xFFFFu)
        prof_hist[i]++;                  /* насыщение: счётчик не обернётся в ноль */
#else
    prof_pc[prof_n & (PROF_RAW_N - 1u)] = pc;   /* кольцо: новая выборка затирает самую старую */
#ifdef PROF_TAG
    prof_tag[prof_n & (PROF_RAW_N - 1u)] = (uint32_t)PROF_TAG;
#endif
#endif
#if PROF_JITTER
    prof_rnd ^= prof_rnd << 13;          /* xorshift32: следующий период — случайной длины */
    prof_rnd ^= prof_rnd >> 17;
    prof_rnd ^= prof_rnd << 5;
    PROF_PERIOD(prof_period + (prof_rnd & PROF_JITTER));
#endif
    if (++prof_n == prof_limit)
        prof_stop();                     /* набрали заказанное — таймер стоп */
}

void prof_start(uint32_t period, uint32_t limit)
{
    prof_n = 0u;
    prof_limit = limit;                  /* 0 — без остановки: в кольце последние PROF_RAW_N выборок */
#if PROF_JITTER
    prof_period = period;
#endif
#if PROF_TIM3
    RCC_APB1ENR |= RCC_TIM3EN;
    TIM_CR1(TIM3_BASE) = 0u;
    TIM_PSC(TIM3_BASE) = PROF_TIM3_PSC;  /* TIM3 16-битный: период длиннее 65 536 отсчётов — через делитель */
    PROF_PERIOD(period);
    TIM_EGR(TIM3_BASE) = 1u;             /* UG: делитель и период действуют сразу */
    TIM_SR(TIM3_BASE) = 0u;              /* флаг от UG не нужен */
    TIM_DIER(TIM3_BASE) = 1u;            /* UIE: прерывание по обновлению */
    NVIC_IPR(TIM3_IRQ) = 0u;             /* приоритет 0 — срочнее всех */
    NVIC_ISER0 = 1u << TIM3_IRQ;
    TIM_CR1(TIM3_BASE) = 1u;             /* CEN */
#else
    SCB_SHPR_SYSTICK = 0u;               /* приоритет 0 — срочнее всех */
    PROF_PERIOD(period);                 /* период — в тактах ядра, до 2^24 */
    SYST_CVR = 0u;
    SYST_CSR = 7u;                       /* ENABLE | TICKINT | CLKSOURCE: счёт от частоты ядра */
#endif
}

void prof_stop(void)
{
#if PROF_TIM3
    TIM_CR1(TIM3_BASE) = 0u;
#else
    SYST_CSR = 0u;
#endif
}

void prof_dump(void)
{
    uint32_t n = prof_n;
#if PROF_HIST
    puts1("prof hist base=0x");
    puthex((uint32_t)&_stext, 8);
    puts1(" shift=");
    putdec(PROF_SHIFT);
    puts1(" n=");
    putdec(n);
    puts1(" out=");
    putdec(prof_out);
    for (uint32_t i = 0; i < PROF_BINS; i++) {
        puts1((i % 16u) ? " " : "\nh ");
        puthex(prof_hist[i], 4);
    }
#else
    uint32_t first = (n > PROF_RAW_N) ? n - PROF_RAW_N : 0u;
    puts1("prof raw n=");
    putdec(n);
    for (uint32_t i = first; i < n; i++) {
        puts1(((i - first) % 8u) ? " " : "\np ");
        puthex(prof_pc[i & (PROF_RAW_N - 1u)], 8);
    }
#ifdef PROF_TAG
    for (uint32_t i = first; i < n; i++) {
        puts1(((i - first) % 8u) ? " " : "\ng ");
        puthex(prof_tag[i & (PROF_RAW_N - 1u)], 8);
    }
#endif
#endif
    puts1("\nend\n");
}
app75a.c — reference programs for the profiler.
/* Раздел 75а: контрольные программы для профилировщика. QEMU, -icount shift=0: одна команда —
 * один отсчёт TIM2. SCEN 1 — три функции с долями около 70/20/10 %; 2 — главный цикл с жёстким
 * периодом (ловушка синхронной выборки); 3 — участок с запретом прерываний; 4 — работа в чужом
 * обработчике; 5 — цена одной выборки. */
#include "prof75a.h"
#include "io75a.h"

#ifndef SCEN
#define SCEN 1
#endif
#ifndef PERIOD
#define PERIOD 1681u                     /* период выборки в тактах SysTick */
#endif
#ifndef SAMPLES
#define SAMPLES 10000u
#endif
#ifndef CHUNKS
#define CHUNKS 1u
#endif

/* сколько выборок набрать — константой в данных: код прошивки от её значения не зависит */
const volatile uint32_t cfg_samples = SAMPLES;

/* три одинаковых цикла: доля времени задаётся числом оборотов */
__attribute__((noinline)) void hot_a(uint32_t n)
{
    for (uint32_t i = 0; i < n; i++)
        __asm volatile("nop");
}

__attribute__((noinline)) void hot_b(uint32_t n)
{
    for (uint32_t i = 0; i < n; i++)
        __asm volatile("nop");
}

__attribute__((noinline)) void hot_c(uint32_t n)
{
    for (uint32_t i = 0; i < n; i++)
        __asm volatile("nop");
}

#if SCEN == 1
#if USE_PSP
static uint32_t pstack[128];

__attribute__((naked, noinline)) static void thread_on_psp(__attribute__((unused)) uint32_t *top)
{
    __asm volatile(
        "msr   psp, r0     \n"
        "movs  r0, #2      \n"           /* CONTROL.SPSEL = 1: основной код — на PSP, как задача ОСРВ */
        "msr   control, r0 \n"
        "isb               \n"
        "bx    lr          \n");
}
#endif

#if BAD_MSP
/* Нарочно неверный пролог: кадр всегда берётся с MSP. В опыте подменяет обработчик из prof75a.c
 * (там символ ослаблен командой objcopy --weaken-symbol). */
void prof_tick(uint32_t pc);

__attribute__((naked)) void SysTick_Handler(void)
{
    __asm volatile(
        "mrs   r0, msp       \n"
        "ldr   r0, [r0, #24] \n"
        "b     prof_tick     \n");
}
#endif

__attribute__((noinline)) static void run(void)
{
    uint32_t limit = cfg_samples;
    for (uint32_t c = 0; c < CHUNKS; c++) {
        uint32_t t0 = now();
        prof_start(PERIOD, limit);
        while (prof_n < limit) {
            hot_a(700);
            hot_b(200);
            hot_c(100);
        }
        puts1("span=");
        putdec(now() - t0);
        puts1("\n");
        prof_dump();
    }
}

int main(void)
{
    uart_init();
    clock_start();
#if USE_PSP
    thread_on_psp(&pstack[128]);
#endif
    run();
    sh_exit();
    for (;;) {
    }
}
#endif

#if SCEN == 2
/* главный цикл с жёстким периодом: раз в TICK команд — управление и фильтр, остальное — ожидание */
#ifndef TICK
#define TICK 9999u
#endif
#ifndef PHASE
#define PHASE 1000u                      /* когда первый запуск цикла относительно старта выборки */
#endif
static uint32_t next_at;

__attribute__((noinline)) void wait_tick(void)
{
    while ((int32_t)(now() - next_at) < 0) {
    }
    next_at += TICK;
}

__attribute__((noinline)) void control(void)
{
    for (uint32_t i = 0; i < 1000u; i++)
        __asm volatile("nop");
}

__attribute__((noinline)) void filter(void)
{
    for (uint32_t i = 0; i < 333u; i++)
        __asm volatile("nop");
}

int main(void)
{
    uint32_t limit = cfg_samples;
    uart_init();
    clock_start();
    prof_start(PERIOD, limit);
    next_at = now() + PHASE;
    while (prof_n < limit) {
        wait_tick();
        control();
        filter();
    }
    prof_dump();
    sh_exit();
    for (;;) {
    }
}
#endif

#if SCEN == 3
/* участок с запретом прерываний: LOCK_N оборотов под cpsid, OPEN_N — с открытыми прерываниями */
#ifndef LOCK_N
#define LOCK_N 300u
#endif
#ifndef OPEN_N
#define OPEN_N 700u
#endif

__attribute__((noinline)) void irq_off(void)
{
    __asm volatile("cpsid i");
}

__attribute__((noinline)) void irq_on(void)
{
    __asm volatile("cpsie i");
}

__attribute__((noinline)) void locked(uint32_t n)
{
    irq_off();
    for (uint32_t i = 0; i < n; i++)
        __asm volatile("nop");
    irq_on();
}

int main(void)
{
    uint32_t limit = cfg_samples;
    uart_init();
    clock_start();
    uint32_t t0 = now();
    prof_start(PERIOD, limit);
    while (prof_n < limit) {
        locked(LOCK_N);
        hot_a(OPEN_N);
    }
    puts1("span=");
    putdec(now() - t0);
    puts1("\n");
    prof_dump();
    sh_exit();
    for (;;) {
    }
}
#endif

#if SCEN == 4
/* работа в чужом обработчике: EXTI0 поднимается программно и крутит 300 оборотов */
#ifndef ISR_PRIO
#define ISR_PRIO 0u                      /* 0 — как у выборки; 0x80 — менее срочный */
#endif
#define NVIC_ISPR0 REG(0xE000E200u)
#define EXTI0_IRQ  6

__attribute__((noinline)) void isr_work(uint32_t n)
{
    for (uint32_t i = 0; i < n; i++)
        __asm volatile("nop");
}

void EXTI0_IRQHandler(void)
{
    isr_work(300);
}

int main(void)
{
    uint32_t limit = cfg_samples;
    uart_init();
    clock_start();
    NVIC_IPR(EXTI0_IRQ) = ISR_PRIO;
    NVIC_ISER0 = 1u << EXTI0_IRQ;
    prof_start(PERIOD, limit);
    while (prof_n < limit) {
        NVIC_ISPR0 = 1u << EXTI0_IRQ;    /* поднять прерывание: обработчик отработает сразу */
        hot_a(700);
    }
    prof_dump();
    sh_exit();
    for (;;) {
    }
}
#endif

#if SCEN == 5
/* цена выборки: одна и та же работа без профилировщика и с ним, разность — команды обработчика */
int main(void)
{
    uart_init();
    clock_start();
    uint32_t t0 = now();
    hot_a(250000);
    uint32_t off = now() - t0;
    prof_start(PERIOD, 0u);
    t0 = now();
    hot_a(250000);
    uint32_t on = now() - t0;
    uint32_t n = prof_n;
    prof_stop();
    puts1("cost off=");
    putdec(off);
    puts1(" on=");
    putdec(on);
    puts1(" samples=");
    putdec(n);
    puts1(" per_sample=");
    putdec((on - off) / n);
    puts1(" rem=");
    putdec((on - off) % n);
    puts1("\n");
    sh_exit();
    for (;;) {
    }
}
#endif
rtos75a.c — sampling under FreeRTOS with a task tag.
/* Раздел 75а: выборка под ОСРВ. FreeRTOS 10.5.1, порт ARM_CM3, QEMU netduino2. Две задачи зовут
 * одну и ту же функцию hot_a; рядом с PC профилировщик кладёт pxCurrentTCB (сборка с
 * -DPROF_TAG=pxCurrentTCB), и выборки делятся не только по функциям, но и по задачам. */
#include "FreeRTOS.h"
#include "task.h"
#include "prof75a.h"
#include "io75a.h"

#ifndef PERIOD
#define PERIOD 1691u
#endif
#ifndef SAMPLES
#define SAMPLES 10000u
#endif

const volatile uint32_t cfg_samples = SAMPLES;
static TaskHandle_t task_handle[2];

__attribute__((noinline)) void hot_a(uint32_t n)
{
    for (uint32_t i = 0; i < n; i++)
        __asm volatile("nop");
}

__attribute__((noinline)) void hot_b(uint32_t n)
{
    for (uint32_t i = 0; i < n; i++)
        __asm volatile("nop");
}

void vPortSetupTimerInterrupt(void)      /* тик ядру не нужен: SysTick занят профилировщиком */
{
}

void rtos_assert(void)
{
    puts1("assert\n");
    sh_exit();
}

static void finish(void)
{
    for (uint32_t i = 0; i < 2u; i++) {  /* таблица «адрес блока задачи — имя» для разбора */
        puts1("task ");
        puthex((uint32_t)task_handle[i], 8);
        putc1(' ');
        puts1(pcTaskGetName(task_handle[i]));
        puts1("\n");
    }
    prof_dump();
    sh_exit();
}

static void task_motor(void *arg)
{
    (void)arg;
    prof_start(PERIOD, cfg_samples);     /* после старта планировщика: он опускает приоритет SysTick */
    for (;;) {
        hot_a(600);
        if (prof_n >= cfg_samples)
            finish();
        taskYIELD();
    }
}

static void task_link(void *arg)
{
    (void)arg;
    for (;;) {
        hot_a(300);
        hot_b(100);
        taskYIELD();
    }
}

int main(void)
{
    uart_init();
    clock_start();
    xTaskCreate(task_motor, "motor", 128, NULL, 1, &task_handle[0]);
    xTaskCreate(task_link, "link", 128, NULL, 1, &task_handle[1]);
    vTaskStartScheduler();
    for (;;) {
    }
}
prof75a.py — summarizes samples into a "function — share of time" table.
#!/usr/bin/env python3
"""Раздел 75а: свести выборки профилировщика в таблицу «функция — доля времени».

    python3 prof75a.py uart.txt fw.elf [первые N выборок]

uart.txt — вывод prof_dump(): строки «p …» с сырыми адресами или «h …» со счётчиками корзин.
Функции и их размеры берутся из таблицы символов ELF командой arm-none-eabi-nm."""
import bisect
import collections
import re
import subprocess
import sys


def load_symbols(elf, nm="arm-none-eabi-nm"):
    """Функции из ELF: список (адрес, размер, имя) по возрастанию адреса."""
    out = subprocess.run([nm, "-n", "-S", "--defined-only", elf],
                         capture_output=True, text=True, check=True).stdout
    syms, seen = [], set()
    for line in out.splitlines():
        f = line.split()
        if len(f) == 4 and f[2] in "TtW" and int(f[0], 16) not in seen:
            seen.add(int(f[0], 16))             # слабые синонимы по тому же адресу — один раз
            syms.append((int(f[0], 16), int(f[1], 16), f[3]))
    return syms


def lookup(syms, pc):
    """Имя функции, в которую попадает адрес, или «?»."""
    i = bisect.bisect_right(syms, (pc, 1 << 32)) - 1
    if i >= 0 and pc < syms[i][0] + syms[i][1]:
        return syms[i][2]
    return "?"


def read_dump(path):
    """Вернуть (сырые адреса, корзины): корзины — список (начало, размер, счётчик)."""
    raw, bins, base, shift, k = [], [], 0, 0, 0
    for line in open(path, encoding="ascii", errors="replace"):
        m = re.match(r"prof hist base=0x([0-9a-f]+) shift=(\d+)", line)
        if m:
            base, shift, k = int(m.group(1), 16), int(m.group(2)), 0
        elif line.startswith("p "):
            raw += [int(x, 16) for x in line.split()[1:]]
        elif line.startswith("h "):
            for x in line.split()[1:]:
                if int(x, 16):
                    bins.append((base + (k << shift), 1 << shift, int(x, 16)))
                k += 1
    return raw, bins


def by_function(syms, raw, bins):
    """Счёт выборок по функциям. Корзина на стыке функций делится между ними по числу байт."""
    cnt = collections.Counter()
    for pc in raw:
        cnt[lookup(syms, pc)] += 1
    for start, size, n in bins:
        owners = [lookup(syms, a) for a in range(start, start + size, 2)]   # команды Thumb — по чётным адресам
        owners = [o for o in owners if o != "?"] or ["?"]                   # заполнитель между функциями не в счёт
        for o in owners:
            cnt[o] += n / len(owners)
    return cnt


def report(cnt):
    total = sum(cnt.values())
    print("samples %d" % round(total))
    for name, n in sorted(cnt.items(), key=lambda kv: (-kv[1], kv[0])):
        print("  %6.2f %%  %8.1f  %s" % (100.0 * n / total, n, name))


if __name__ == "__main__":
    symbols = load_symbols(sys.argv[2])
    samples, buckets = read_dump(sys.argv[1])
    if len(sys.argv) > 3:
        samples = samples[:int(sys.argv[3])]
    report(by_function(symbols, samples, buckets))
dwt75a.c — PC sampling by the core itself through DWT and ITM.
/* Раздел 75а, способ B: выборку PC ведёт само ядро. Блок DWT раз в заданное число тактов
 * выдаёт пакет с текущим PC, ITM ставит его в поток, поток уходит по линии SWO в отладчик.
 * Нужны Cortex-M3/M4/M7 и отладчик, принимающий SWO. Заголовки — CMSIS из пака устройства. */
#if defined(STM32F10X_MD)
#include "stm32f10x.h"
#else
#include "stm32f4xx.h"
#endif

#define PCS_TAP_64    0u                 /* шаг POSTCNT — бит 6 счётчика тактов: раз в 64 такта */
#define PCS_TAP_1024  1u                 /* бит 10: раз в 1024 такта */

void swo_init(void);                     /* раздел 21.2: TRACE_IOEN, TRCENA, ключ ITM, делитель SWO, ITMENA */

_Static_assert(DWT_CTRL_PCSAMPLENA_Msk == (1u << 12), "PCSAMPLENA - bit 12");
_Static_assert(DWT_CTRL_CYCTAP_Msk == (1u << 9), "CYCTAP - bit 9");
_Static_assert(DWT_CTRL_POSTINIT_Msk == (0xFu << 5), "POSTINIT - bits 8:5");
_Static_assert(DWT_CTRL_POSTPRESET_Msk == (0xFu << 1), "POSTPRESET - bits 4:1");
_Static_assert(DWT_CTRL_CYCEVTENA_Msk == (1u << 22), "CYCEVTENA - bit 22");
_Static_assert(DWT_CTRL_CYCCNTENA_Msk == 1u, "CYCCNTENA - bit 0");
_Static_assert(ITM_TCR_DWTENA_Msk == (1u << 3), "ITM TCR DWTENA - bit 3");

/* Включить периодическую выборку PC: tap — PCS_TAP_64 или PCS_TAP_1024, reload — 0…15. */
void pcs_start(uint32_t tap, uint32_t reload)
{
    swo_init();
    ITM->TCR |= ITM_TCR_DWTENA_Msk;      /* пропускать пакеты DWT в поток ITM */

    /* POSTINIT пишется, только пока POSTCNT выключен: сначала снять оба разрешения */
    DWT->CTRL &= ~(DWT_CTRL_PCSAMPLENA_Msk | DWT_CTRL_CYCEVTENA_Msk);
    DWT->CYCCNT = 0u;
    DWT->CTRL = (DWT->CTRL & ~(DWT_CTRL_CYCTAP_Msk | DWT_CTRL_POSTPRESET_Msk | DWT_CTRL_POSTINIT_Msk))
              | (tap << DWT_CTRL_CYCTAP_Pos)
              | (reload << DWT_CTRL_POSTPRESET_Pos)      /* с какого числа POSTCNT считает вниз */
              | (reload << DWT_CTRL_POSTINIT_Pos)        /* и с какого начинает */
              | DWT_CTRL_CYCCNTENA_Msk;                  /* POSTCNT шагает по биту CYCCNT: счётчик тактов должен идти */
    DWT->CTRL |= DWT_CTRL_PCSAMPLENA_Msk;                /* выборка пошла */
}

void pcs_stop(void)
{
    DWT->CTRL &= ~DWT_CTRL_PCSAMPLENA_Msk;
}
itm75a.py — parser for the ITM/DWT stream from the SWO line.
#!/usr/bin/env python3
"""Раздел 75а, способ B: разбор потока ITM/DWT с линии SWO — достать пакеты выборки PC.

    python3 itm75a.py parse swo.bin [--sync] > dump.txt     адреса — строками «p …» для prof75a.py
    python3 itm75a.py gen   dump.txt swo.bin                синтетический поток из дампа способа A
    python3 itm75a.py test  dump.txt                        собрать поток, разобрать, сравнить

Формат пакетов — как его разбирает pyOCD (github.com/pyocd/pyOCD, pyocd/trace/swo.py)."""
import sys

SYNC = bytes([0, 0, 0, 0, 0, 0x80])


def parse(data, wait_sync=False):
    """Вернуть список событий (тип, значение, …). Типы: pc, sleep, itm, cnt, exc, dwt, sync, ovf, ts, bad."""
    i, out = 0, []
    if wait_sync:                               # подключились посреди потока: ждать синхропакет
        i = data.find(SYNC)
        i = len(data) if i < 0 else i
    while i < len(data):
        h = data[i]
        i += 1
        if h == 0x00:                           # синхропакет: нули и завершающий 0x80
            j = i
            while j < len(data) and data[j] == 0x00:
                j += 1
            if j < len(data) and data[j] == 0x80 and j - i >= 4:
                out.append(("sync",))
            else:
                out.append(("bad", h))
            i = j + 1
        elif h == 0x70:                         # переполнение: часть пакетов потеряна
            out.append(("ovf",))
        elif h & 0x03 == 0:                     # служебный пакет: метка времени или расширение
            while h & 0x80 and i < len(data):   # бит 7 — «дальше ещё байт»
                h = data[i]
                i += 1
            out.append(("ts",))
        else:                                   # пакет источника: 1, 2 или 4 байта данных
            size = 1 << ((h & 0x03) - 1)
            if i + size > len(data):
                break                           # хвост потока оборван посреди пакета
            value = int.from_bytes(data[i:i + size], "little")
            i += size
            src = h >> 3
            if h & 0x04 == 0:
                out.append(("itm", src, value, size))       # запись программы в канал src
            elif src == 2:                                  # периодическая выборка PC
                out.append(("pc", value) if size == 4 else ("sleep", value))
            elif src == 0:
                out.append(("cnt", value))                  # переполнение счётчика событий DWT
            elif src == 1:
                out.append(("exc", value))                  # вход в исключение и выход
            else:
                out.append(("dwt", src, value))             # трассировка данных
    return out


def pc_packet(pc):
    return bytes([0x17]) + pc.to_bytes(4, "little")         # 0x17 = источник 2, железный, 4 байта


def synth(pcs):
    """Поток, какой дала бы линия SWO: выборки PC вперемешку с остальными видами пакетов."""
    s = bytearray(SYNC)
    for k, pc in enumerate(pcs):
        s += pc_packet(pc)
        if k % 7 == 3:
            s += bytes([0x01, 0x48 + k % 20])               # канал 0, один байт (printf раздела 21)
        if k % 50 == 10:
            s += bytes([0x0B]) + (k * 977).to_bytes(4, "little")    # канал 1, слово (замер из 21.9)
        if k % 64 == 20:
            s += bytes([0x15, 0x00])                        # выборка во сне: PC нет
        if k % 100 == 30:
            s += bytes([0xC0, 0x85, 0x12])                  # метка времени с двумя байтами продолжения
        if k % 100 == 60:
            s += bytes([0x0E, 0x0F, 0x10])                  # трассировка исключений: вход в SysTick (15)
        if k % 500 == 250:
            s += bytes([0x05, 0x04])                        # переполнение счётчика событий
        if k % 1000 == 500:
            s += bytes([0x70])                              # переполнение
        if k % 1000 == 999:
            s += SYNC
    s += bytes([0x20])                                      # короткая метка времени — последним пакетом
    return bytes(s)


def read_pcs(path):
    pcs = []
    for line in open(path, encoding="ascii", errors="replace"):
        if line.startswith("p "):
            pcs += [int(x, 16) for x in line.split()[1:]]
    return pcs


def dump(events):
    pcs = [e[1] for e in events if e[0] == "pc"]
    print("prof raw n=%d" % len(pcs))
    for k in range(0, len(pcs), 8):
        print("p " + " ".join("%08x" % pc for pc in pcs[k:k + 8]))
    print("end")


def count(events):
    kinds = ("pc", "sleep", "itm", "cnt", "exc", "dwt", "sync", "ovf", "ts", "bad")
    return " ".join("%s=%d" % (k, sum(1 for e in events if e[0] == k)) for k in kinds)


if __name__ == "__main__":
    cmd = sys.argv[1]
    if cmd == "parse":
        dump(parse(open(sys.argv[2], "rb").read(), "--sync" in sys.argv))
    elif cmd == "gen":
        open(sys.argv[3], "wb").write(synth(read_pcs(sys.argv[2])))
    elif cmd == "test":
        src = read_pcs(sys.argv[2])
        stream = synth(src)
        ev = parse(stream)
        print("packet for pc 0x%08x: %s" % (src[0], pc_packet(src[0]).hex(" ")))
        print("stream %d bytes from %d samples: %s" % (len(stream), len(src), count(ev)))
        print("decoded = source: %s" % ("yes" if [e[1] for e in ev if e[0] == "pc"] == src else "NO"))
        cut = stream[5005:]                                 # приёмник включился посреди пакета
        blind, synced = parse(cut), parse(cut, wait_sync=True)
        tail = [e[1] for e in synced if e[0] == "pc"]
        print("cut at byte 5005: %s" % cut[:8].hex(" "))
        print("  no sync wait, first events: %s" % " ".join(str(e) for e in blind[:2]))
        print("  wait for sync: %s; tail of source: %s"
              % (count(synced), "yes" if tail and tail == src[len(src) - len(tail):] else "NO"))
Next: section 76 "Algorithms".